Blog

  • Building Performance Colorado (BPC) & HB 25-1269: Benchmarking, 2030 Targets & EPCA Litigation

    Building Performance Colorado (BPC) & HB 25-1269: Benchmarking, 2030 Targets & EPCA Litigation

    Short answer: Colorado’s statewide building performance statute remains live and binding for 2030—even though HB 25-1269 removed mandatory penalties around the interim 2026 milestone. Under Building Performance Colorado (BPC) and HB 25-1269, covered owners of commercial, multifamily, and public buildings of 50,000 gross sq ft or more must continue annual November 1 benchmarking ($100 fee) and remain legally on track for the 2030 20% sector emissions/EUI target.

    Two structural traps catch Colorado asset managers off guard: mistaking HB 25-1269’s voluntary 2026 state target for a pause on municipal Energize Denver interim caps, and assuming pending federal EPCA litigation excuses annual state reporting.

    Statutory Status at a Glance
    • Governing Authority: C.R.S. § 25-7-142 (HB 21-1286), HB 25-1269 (2025), and AQCC Regulation 28 (5 CCR 1001-32).
    • Administering Agencies: Colorado Energy Office (CEO) & CDPHE Air Quality Control Commission.
    • Covered Threshold: Commercial, multifamily, and public buildings ≥50,000 gross sq ft statewide.
    • Annual Benchmarking: Due every November 1 via Portfolio Manager with a $100 annual compliance fee.
    • 2026 vs. 2030 Split & Litigation: 2026 7% state target is now voluntary/non-penalty (HB 25-1269); 2030 20% target stays binding; Colorado Apartment Association v. Ryan (D. Colo.) EPCA challenge active without stay.
    Print-First Compliance Brief

    Navigate Colorado BPC, HB 25-1269 Relief, and Energize Denver Overlap

    2-page quick card distinguishing Colorado’s voluntary 2026 goal from binding 2030 targets, annual Nov 1 filing ($100 fee), and EPCA litigation status.

    What HB 25-1269 Changed—and What Stayed Binding

    Under the original HB 21-1286 and Regulation 28 schedule, buildings ≥50,000 sq ft faced an intermediate 7% sector-wide reduction milestone in 2026 ahead of the 20% reduction target in 2030. Recognizing post-pandemic grid mix and capital lead times, the General Assembly enacted HB 25-1269 in 2025.

    HB 25-1269 expressly converted the 2026 7% interim goal into a non-enforceable voluntary goal, relieving owners from state interim civil penalties in 2026–2027. However, HB 25-1269 left the November 1 annual benchmarking obligation intact and preserved full statutory authority for the 2030 20% sector emissions/EUI reduction requirement.

    • Compliance Pathway Flexibility: Building owners select between hitting a property-type Energy Use Intensity (EUI) target, an operational Greenhouse Gas Intensity (GHGI) target, or a standardized percentage EUI/GHG reduction pathway under Regulation 28.
    • 2026 Election Trajectory Context (Inferred): Following the November 2026 Colorado House shift to a 45/65 two-thirds majority, legislative repeal risk against the 2030 BPC statutory mandate is low, signaling long-run regulatory continuity for decarbonization planning.
    Obligation LayerScope & CitationCurrent Deadlines & Enforceability
    Annual BenchmarkingC.R.S. § 25-7-142 (>=50k sq ft)Annual Nov 1 Portfolio Manager report + $100 fee (Live/Mandatory)
    2026 Interim Target (7%)HB 25-1269 (amending Reg 28)Converted to non-enforceable voluntary target (No 2026 state fine)
    2030 Binding Target (20%)5 CCR 1001-32 (AQCC Reg 28)Mandatory 2030 EUI / GHGI / % reduction compliance preserved
    EPCA Preemption SuitColorado Apt. Assoc. v. Ryan (D. Colo.)Litigation active; no injunction staying BPC filings or 2030 roadmap
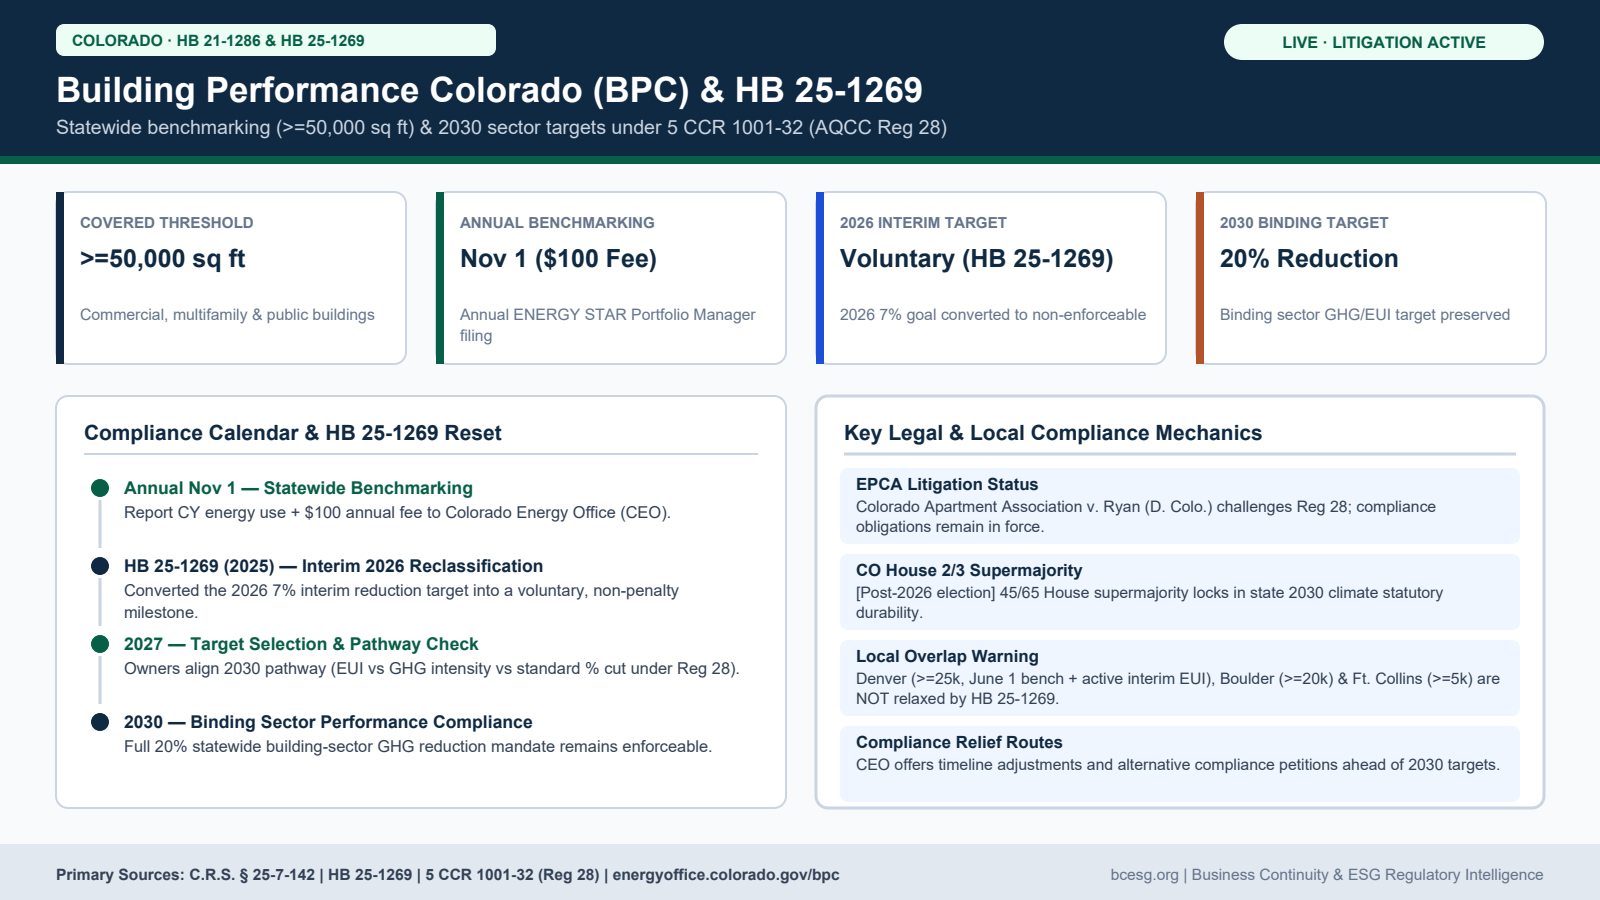
    Summary diagram of Building Performance Colorado (BPC) >=50,000 sq ft November 1 benchmarking, HB 25-1269 voluntary 2026 interim target reset, 2030 binding reduction, and EPCA litigation posture.
    Building Performance Colorado (BPC) statutory calendar under C.R.S. § 25-7-142, HB 25-1269 (2025), and 5 CCR 1001-32 (AQCC Reg 28).

    Don't Confuse State Relief With Energize Denver or Local Rules

    Colorado owners frequently apply statewide HB 25-1269 logic across Denver, Boulder, Fort Collins, and Aspen portfolios—creating unexpected local noncompliance. Local ordinances operate on independent home-rule statutory authority and lower square-footage triggers.

    Owners managing multi-state western real estate should cross-check Colorado’s 50,000 sq ft floor against Washington CBPS (>20,000 sq ft Tier 2) and California AB 802 (>50,000 sq ft June 1 benchmarking) to harmonize Portfolio Manager data requests across utilities.

    • Denver (Energize Denver, DRMC Ch. 4): Covers buildings ≥25,000 sq ft with June 1 annual benchmarking and separate interim/final EUI caps—NOT converted to voluntary by state HB 25-1269.
    • Boulder & Fort Collins: Boulder mandates ≥20,000 sq ft annual benchmarking plus 10-year audits/RCx and LED retrofits; Fort Collins BEWS requires annual June 1 benchmarking down to 5,000 sq ft.

    Litigation Posture: Colorado Apartment Association v. Ryan

    Industry groups filed Colorado Apartment Association v. Ryan in U.S. District Court (D. Colo.) arguing federal Energy Policy and Conservation Act (EPCA) preemption against state building energy caps. Because no court injunction currently suspends BPC benchmarking or Regulation 28’s 2030 planning obligations, owners should treat litigation as background legal risk rather than a filing excuse—similar to how NYC Local Law 97 compliance proceeded to Court of Appeals resolution while deadlines ran.

    Compliance Execution Checklist

    StepOwner / TeamAuditable Deliverable
    1. Annual Nov 1 FilingProperty MgrFile whole-building Portfolio Manager data + remit $100 fee to Colorado Energy Office before Nov 1.
    2. Pathway AuditEnergy EngineerSelect optimal 2030 Reg 28 pathway (EUI vs. GHGI vs. standard %) and verify meter accuracy.
    3. Municipal SeparationPortfolio LeadSegregate Denver (>=25k), Boulder (>=20k), Ft. Collins (>=5k), and Aspen schedules from state BPC rules.
    4. CapEx & PetitionsAsset FinanceDocument equipment end-of-life windows and file CEO timeline adjustments early if hardship applies.
    Field & Print Package

    Keep This Colorado Compliance Checklist Handy

    Download the formatted 2-page PDF reference brief or pull the structured Markdown edition for internal compliance documentation.

    Frequently Asked Questions

    Did HB 25-1269 repeal Building Performance Colorado?

    No. HB 25-1269 converted only the interim 2026 7% reduction goal into a non-enforceable voluntary milestone. Annual November 1 benchmarking ($100 fee) and the 2030 binding 20% sector reduction target under AQCC Regulation 28 remain in force.

    When is annual Colorado BPC benchmarking due?

    Every November 1 for buildings of 50,000 gross sq ft or more, accompanied by a $100 annual fee paid to the Colorado Energy Office.

    Does HB 25-1269 relax Energize Denver deadlines for my Denver building?

    No. Energize Denver is a separate municipal ordinance (covering buildings >=25,000 sq ft with June 1 annual benchmarking and local EUI targets) unaffected by Colorado's state interim adjustment.

    Primary Authorities & Official Resources

    Informational notice: This guide summarizes enacted statutes, regulations, or pending legislative records from the primary authorities linked above as of November 14, 2026. It is not legal, accounting, or licensed engineering advice.

  • Washington Clean Buildings Performance Standard (CBPS): Tier 1 & Tier 2 Compliance Guide

    Washington Clean Buildings Performance Standard (CBPS): Tier 1 & Tier 2 Compliance Guide

    Short answer: Washington’s Clean Buildings Performance Standard (CBPS) is already in active statutory enforcement for the state’s largest nonresidential buildings. Under RCW 19.27A.200–.240 and Washington Department of Commerce rules (WAC 194-50), Tier 1 buildings over 220,000 sq ft faced their initial June 1, 2026 compliance date, followed by staggered 2027 and 2028 deadlines extending down to 20,000 sq ft commercial and multifamily properties.

    Unlike pure benchmarking laws that stop at energy score disclosure, Washington CBPS pairs mandatory governance—a designated Energy Manager, a living Energy Management Plan (EMP), and an Operations & Maintenance (O&M) program—with enforceable Energy Use Intensity targets (EUIt) or Life Cycle Cost Analysis (LCCA) investment packages for Tier 1 properties.

    Statutory Status at a Glance
    • Governing Authority: RCW 19.27A.200–.240 (HB 1257 of 2019; expanded by SB 5722 of 2022) & WAC 194-50.
    • Administering Agency: Washington Department of Commerce Clean Buildings Program.
    • Tier 1 Deadlines: June 1, 2026 (>220,000 sq ft); June 1, 2027 (90,001–220,000 sq ft); June 1, 2028 (50,001–90,000 sq ft).
    • Tier 2 Deadline: July 1, 2027 for commercial 20,000–50,000 sq ft and all multifamily residential >20,000 sq ft (benchmarking + EMP + O&M).
    • Maximum Penalty: Up to $5,000 base fine plus $1.00 per square foot of gross floor area per year of continued Tier 1 non-compliance (Tier 2 carries separate benchmarking/reporting enforcement).
    Print-First Compliance Brief

    Operationalize Washington CBPS Compliance Across Tier 1 & Tier 2 Assets

    Field-ready 2-page PDF reference covering WA Commerce EUIt pathways, EMP/O&M governance, June 2026–2028 deadlines, and Tier 2 multifamily duties.

    Tier 1 vs. Tier 2 Coverage and Phased Deadlines (2026–2028)

    Following the 2022 passage of SB 5722, Washington divided covered stock into two statutory tiers using conditioned vs. gross floor area excluding parking garages. Every covered building sits on a recurring 5-year compliance cycle anchored to its size band.

    Owners with multi-building campuses should verify whether campus-level or individual-building metering governs their Commerce Clean Buildings Portal account, as single-campus utility feeds alter EUIt baseline normalization.

    • Tier 1 (Nonresidential, Hotels, Motels & Dormitories >50,000 sq ft): Must benchmark weather-normalized EUI, adopt an EMP and O&M program, and either meet the assigned property-type EUIt or execute all cost-effective measures identified via an ASHRAE Standard 100 / LCCA investment audit.
    • Tier 2 (Commercial 20,000–50,000 sq ft & Multifamily >20,000 sq ft): Currently requires Portfolio Manager benchmarking, an Energy Management Plan, and an O&M manual by July 1, 2027—without a numeric Tier 1 EUIt cap in this initial cycle.
    Building CategorySize & Property ScopeStatutory Duty & Next Deadlines
    Tier 1 — LargestNonresidential, hotels, motels, dorms >220,000 sq ftEUIt / LCCA + EMP + O&M due June 1, 2026 (active; 5-yr cycle)
    Tier 1 — Mid-LargeNonresidential, hotels, motels, dorms 90,001–220,000 sq ftEUIt / LCCA + EMP + O&M due June 1, 2027
    Tier 1 — BaseNonresidential, hotels, motels, dorms 50,001–90,000 sq ftEUIt / LCCA + EMP + O&M due June 1, 2028
    Tier 2 — Small / MFCommercial 20,000–50,000 sq ft & Multifamily >20,000 sq ftBenchmarking + EMP + O&M due July 1, 2027 (no EUI cap yet)
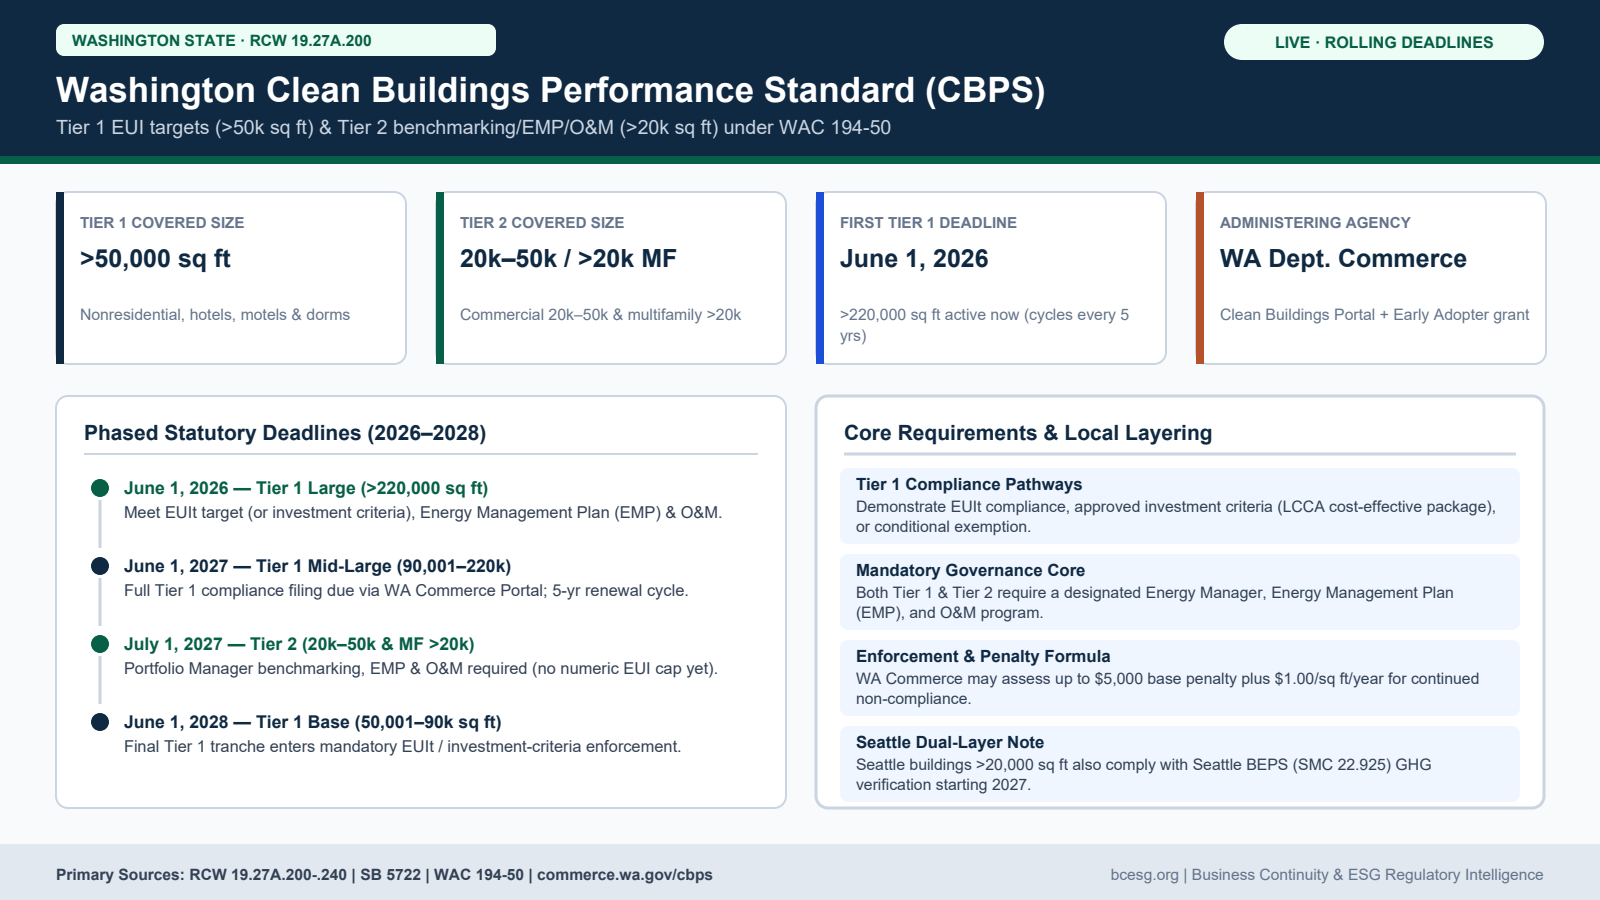
    Visual compliance summary of Washington Clean Buildings Performance Standard (CBPS) Tier 1 >50,000 sq ft and Tier 2 >=20,000 sq ft deadlines, pathways, and penalty formulas.
    Washington Clean Buildings Performance Standard (CBPS) Tier 1 and Tier 2 deadlines, governance core, and statutory enforcement formula under RCW 19.27A.200–.240 and WAC 194-50.

    Compliance Pathways, EMP Governance, and Conditional Exemptions

    Washington’s Department of Commerce evaluates Tier 1 submissions through three operational doors inside the Clean Buildings Portal. Selecting the wrong pathway late in the cycle creates avoidable audit risk because LCCA engineering studies and O&M logs require at least 12 months of documented execution prior to filing.

    If a building operates in Seattle (>20,000 sq ft), remember that compliance with statewide CBPS does not exempt the asset from Seattle’s Building Emissions Performance Standard (SMC 22.925), which adds municipal GHG intensity (GHGI) reporting and verification beginning in 2027. Portfolios crossing the Columbia River should also align schedules with Oregon’s HB 3409 BPS, which mirrors Washington’s Tier 1/Tier 2 architecture.

    • EUIt Compliance Path: Demonstrate weather-normalized EUI at or below the Commerce target for your occupancy mix.
    • Investment Criteria Path (LCCA): When achieving EUIt is technically or economically infeasible, submit a qualified Energy Audit and Life Cycle Cost Analysis proving every package meeting statutory ROI criteria was installed.
    • Conditional Exemptions: Covers low occupancy (<50% physical occupancy during measurement year), agricultural/industrial process loads exceeding 50% of energy use, pending demolition permits, or severe financial hardship verified with Commerce prior to deadline.

    Penalties and Financial Risk Comparison Across Jurisdictions

    Failure to document an EMP, O&M program, or EUIt compliance under WAC 194-50 triggers formal notices prior to fine assessment. Because maximum statutory fines compound up to $5,000 plus $1.00/sq ft annually, a 150,000 sq ft non-compliant office tower faces up to $155,000 per year in civil exposure before accounting for capital catch-up costs.

    Compared against east-coast carbon caps such as NYC Local Law 97 ($268/tCO2e) or Washington D.C. BEPS, Washington’s investment criteria safety valve protects capital-constrained owners—provided documentation begins early enough to run a full 12-month metered O&M cycle.

    Compliance Execution Checklist

    StepOwner / TeamAuditable Deliverable
    1. Portal ClaimingAsset MgmtVerify WA Commerce Clean Buildings Portal building ID, square footage (excl. garage), and Tier 1/2 tiering.
    2. EMP & O&M SetupChief EngineerAppoint qualified Energy Manager and launch written EMP + 12-month documented O&M preventive logs.
    3. Pathway AuditPE / ASHRAE AuditorRun Portfolio Manager EUI gap check; initiate ASHRAE Level 2 / LCCA study immediately if above EUIt.
    4. Exemption / FilingCompliance LeadSubmit conditional exemptions or Early Adopter Incentive claims ahead of June 1 / July 1 statutory dates.
    Field & Print Package

    Keep This Washington State Compliance Checklist Handy

    Download the formatted 2-page PDF reference brief or pull the structured Markdown edition for internal compliance documentation.

    Frequently Asked Questions

    Do multifamily apartment buildings have to meet EUIt energy caps under Washington CBPS?

    Not under the current statutory cycle. Multifamily residential buildings greater than 20,000 sq ft fall under Tier 2, which requires ENERGY STAR Portfolio Manager benchmarking, an Energy Management Plan (EMP), and an O&M program by July 1, 2027, rather than numeric Tier 1 EUIt limits.

    What happens if a Tier 1 building misses its June 1, 2026 compliance date?

    The Washington Department of Commerce issues violation notices with mitigation windows before imposing statutory penalties up to $5,000 base plus $1.00 per square foot per year of continued non-compliance under WAC 194-50.

    Does complying with Washington CBPS satisfy Seattle BEPS?

    No. Covered Seattle buildings greater than 20,000 sq ft must comply with both statewide WA CBPS and Seattle's municipal Building Emissions Performance Standard (SMC 22.925), which introduces GHG emissions verification starting in 2027.

    Primary Authorities & Official Resources

    Informational notice: This guide summarizes enacted statutes, regulations, or pending legislative records from the primary authorities linked above as of November 14, 2026. It is not legal, accounting, or licensed engineering advice.

  • Is Scope 2 Splitting Into Two Market-Based Methods? What Changes for Purchased-Electricity Claims

    Is Scope 2 Splitting Into Two Market-Based Methods? What Changes for Purchased-Electricity Claims

    Short answer: Not yet — and not by itself. In September 2026 the GHG Protocol’s Independent Standards Board (ISB) set a direction of travel for the Scope 2 revision: two market-based methods, running side by side for a transition period. Method 2 is the current 2015 method, unchanged. Method 1 is a stricter method built on hourly matching, deliverability and incrementality. Method 1 would be the recommended method during the transition, companies would have to disclose which method they used, and after a cutoff date that has not been set, Method 1 would become the required method wherever data meeting the quality criteria is available. None of this is in force. The 2015 Scope 2 Guidance remains the operative standard, and nothing you report today changes because of this decision.

    That distinction — direction set, rules not changed — is the whole story for anyone buying renewable energy certificates (RECs) or signing power purchase agreements (PPAs) against a Scope 2 claim this year: it tells you where certificate buying is heading, and it does not change what counts in your current inventory.

    Status at a glance

    • In force now: the GHG Protocol Scope 2 Guidance (2015), including dual reporting. No revision has been adopted.
    • Decided: nothing final. The ISB recorded majority support in July 2026 for developing two market-based methods, and set a direction of travel in September 2026 for the working group to refine.
    • Still open: the transition cutoff date; whether market-based reporting will be a “shall”, a “should” or a “may”; Method 2’s reporting unit; the incrementality window; any exemption threshold for smaller consumers.
    • Next milestones: a consolidated public consultation (Scopes 1, 2, 3 and market instruments), planned Q2 2027; the joint GHG Protocol–ISO Corporate Standard, planned for publication in Q4 2028.
    • Planning assumption, not a decision: working-group materials have used 2030 as an assumed effective date for a revised standard. Treat it as a placeholder.

    The rules you are actually reporting under: the 2015 Guidance in brief

    Scope 2 covers the emissions from generating the electricity, steam, heat and cooling a company buys. (New to the scopes? Our plain-English explainer, Scope 1, 2 and 3: The One Rule That Sorts Them, sets out how they divide.) The Scope 2 Guidance, published in 2015 as an amendment to the Corporate Standard, asks companies in markets that offer contractual instruments to report Scope 2 two ways:

    • Location-based: your consumption multiplied by the average emissions intensity of the grid where it happens. It answers: what does the grid I physically draw from look like?
    • Market-based: your consumption priced through the contractual instruments you have actually bought — energy attribute certificates, direct contracts, supplier-specific emission rates — with anything not covered taking the residual mix, the factor for electricity left in the market after everyone else’s claims are removed. It answers: what did I choose to buy?

    Market-based instruments only count if they meet the Guidance’s eight Scope 2 Quality Criteria. The ones that bite in practice: the instrument must convey the emission rate of the electricity generated; be the only instrument carrying that claim; be tracked and retired or cancelled by you or on your behalf; be issued and redeemed as close as possible to the period when you consumed the electricity; and come from the same market as your consuming operations. Note what those criteria do not require: matching within the year is enough, the market boundary is broad, and the age of the generating plant is irrelevant. A certificate from a decades-old hydro plant three states away can satisfy the 2015 criteria today. That gap — between what the accounting rewards and what physically supplies a building — is what the revision is about. (Our corporate carbon footprint calculator produces the location-based figure and states plainly that market-based accounting is outside its scope.)

    How the revision got to two methods

    The Scope 2 Technical Working Group began work in September 2024. Its proposed revisions went to public consultation from 20 October 2025 to 31 January 2026, drawing nearly 1,100 responses from 56 countries. The consultation draft proposed a single, stricter market-based method: certificates would count only if matched to consumption hour by hour and generated in a grid region that can actually deliver power to the consumer. The location-based method would also have been tightened, toward the most precise grid factor freely available — location precision first, then time.

    Feedback split into two camps — two theories of change, in the GHG Protocol’s own October 2026 update. One argues that clean power matched by the hour, delivered on the same grid, and generated by recently built plants pushes demand toward new clean generation where and when it is scarcest. The other argues that annual matching and wide boundaries keep the certificate market large, liquid and easy to join. Neither camp won. In April 2026 the ISB decided it would set the direction and the working group would resolve the open questions; the Secretariat’s proposal — one method per theory of change — became Method 1 and Method 2.

    The two methods, side by side

    Method 1 is the strict track. Three requirements define it:

    • Hourly matching. Certificates count against consumption in the hour they were generated, not across a year. A megawatt-hour of solar generated at noon in July does not offset a megawatt-hour consumed at 7 p.m. in January.
    • Deliverability. The generation must sit in a grid region that can deliver power to your operations — market boundaries aligned with the physical grid, not with a national certificate market.
    • Incrementality. Eligible generation would be limited by plant age, so claims rest on relatively new capacity. The window has not been set.

    Method 2 is the 2015 method carried forward: annual (or monthly) matching within existing market boundaries, the current Quality Criteria, legacy procurement strategies left intact. Under the September 2026 direction, companies could report under Method 2 until the cutoff date, should use Method 1 in the meantime, and must disclose which of the two a figure rests on. After the cutoff, a market-based figure would have to be a Method 1 figure where quality data is available. One level up, whether reporting a market-based figure at all will be required, recommended or optional — the “shall / should / may” wording — is explicitly unresolved.

    There is also a side door worth knowing about. The parallel Actions and Market Instruments workstream is developing a multi-statement framework in which procurement that does not meet market-based requirements can still be reported — in a GHG Impact Statement, or as non-GHG indicators such as the share of consumption matched with clean power. The direction is not “buy differently or claim nothing”; it is “claim it in the statement that matches what you actually did.” The ISO working group drafting the joint standard has reportedly taken a different line on some elements, including monthly rather than hourly matching as a floor.

    What hourly matching would actually demand

    Method 1 is as much a data requirement as a procurement rule. Claiming under it would take:

    • Interval consumption data. You cannot match hourly if your meter history is a monthly bill total. Hourly or sub-hourly meter data — utility, submeter, or building management system — becomes the evidentiary base of the claim.
    • Time-stamped certificates. Certificates would need generation timestamps granular enough to match, and a registry trail that preserves them.
    • A paper trail per instrument. Plant location and grid region, generation dates and hours, megawatt-hours, vintage, and retirement proof in the reporter’s name — the records that let an assurance provider test deliverability and matching rather than take them on faith.
    • Procurement shaped to a load profile. A flat annual REC purchase stops being a complete strategy. Matching a building that peaks on winter evenings points toward wind, storage-backed products or firmed hourly-matched PPAs — and toward knowing your hourly load shape before you shop.

    For a property manager, the translation is blunt: the buildings that will struggle under Method 1 are not the ones buying the wrong certificates. They are the ones that cannot say, hour by hour, what they consumed.

    What to do now, and what to wait on

    Do now:

    • Keep reporting both Scope 2 figures under the 2015 Guidance. Dual reporting is the current requirement, and regulators are building on it as it stands — California’s Air Resources Board staff proposal for 2027 SB 253 reports asks for both numbers under the current Guidance.
    • Ask your utilities and metering providers, in writing, whether hourly or interval data is available for each site, and keep the answer. It is the cheapest future-proofing available.
    • Tighten certificate records to the standard Method 1 would test: plant, location, vintage, megawatt-hours, retirement confirmation.
    • When a PPA or green tariff comes up for renewal, ask the hourly question — what share of our consumption would this product match hour by hour, in our grid region? — and file the answer, even if you buy on 2015 terms this cycle.
    • Brief whoever assures your inventory on which method each figure uses. Method disclosure is the one element of the September direction stated as a “shall” — expect it to survive into the final text.

    Wait on:

    • Do not restate past inventories, and do not describe any current figure as “Method 1” — the method does not exist yet as a standard, and claiming early compliance with an unfinished rule is a greenwashing exposure, not a head start.
    • Do not pay a premium for hourly-matched products solely for accounting reasons until the cutoff date, the incrementality window and the data-quality criteria are set. There may be energy or risk reasons to buy them; the accounting reason is not yet bankable.
    • Do not let a vendor sell you the revision as a 2027 compliance deadline. The next milestone is a consultation in Q2 2027 — a chance to comment, not a filing date.

    What stays unchanged

    The location-based figure is not going anywhere; both methods in the proposed split are versions of the market-based method, and the two-number structure of Scope 2 reporting survives the direction set so far. The physical point underneath the accounting also survives: certificates allocate claims, they do not reroute electrons. What the September 2026 direction changes is the long-run terms on which the contractual story will be believed. The wider standards landscape is tracked in our Environmental ESG complete professional guide, and we will update this page when the consolidated consultation draft is published.

    This article is general information about a standards revision in progress, based on the GHG Protocol’s published update of 16 October 2026 and the ISO–GHG Protocol partnership announcements. It is not accounting advice. The GHG Protocol Scope 2 Guidance (2015) remains the operative standard until a revised standard is published and takes effect; consult your assurance provider on your own inventory.

  • Compliance, in Plain English

    Compliance, in Plain English

    Compliance means knowing which rules apply to your company, doing what those rules require, and being able to show your work. In an ESG sense, the rules concern environmental impact, treatment of people, and how the company is run: the permit that limits a discharge, the emissions figure that must be reported, the supplier practice that must be checked, and the public claim that must be true. A company is not compliant because it has good intentions or a polished report. It is compliant when each obligation has been identified, met on time, and backed by evidence someone else can inspect.

    That sounds simple because the idea is simple. The difficulty is that “the rules” do not arrive as one tidy list. They come from different governments, regulators, customers, lenders, contracts, and standards, and they change at different speeds. BC ESG’s ESG Meaning page separates the wider term into its environmental, social, and governance parts. Compliance is where those categories turn into specific duties with owners, dates, thresholds, and records.

    The three jobs inside the word

    1. Know the rule

    First, the company has to know that an obligation exists and whether it applies. That means identifying the jurisdiction, entity, activity, threshold, reporting period, deadline, and current legal status. A proposal is not yet a duty. A paused rule is not the same as a live one. A rule covering a parent company may not cover every subsidiary in the same way.

    This is why a compliance register matters. It is not a folder of PDFs. It is the working list of what is owed, to whom, by when, under which test, and with what evidence. Without that list, compliance depends on memory and whoever happens to hear about a rule first.

    2. Meet the rule

    Next, the company has to do the thing required: measure the emissions, stay inside the permit limit, collect the supplier evidence, correct the unsafe practice, publish the disclosure, or stop making the claim it cannot support. Meeting the rule may require new data, a changed process, capital spending, training, or a decision to withdraw a product or statement.

    A policy by itself does not meet a rule. “We require suppliers to respect human rights” is only a sentence until purchasing knows what evidence to request, what finding triggers action, and who can pause an order. A climate target is not a filing. A code of conduct is not proof that the conduct happened.

    3. Prove it

    Finally, the company must be able to show what it did. Proof can be a meter record, calculation, inspection, approval, training log, supplier audit, board minute, filing confirmation, or assurance report. The evidence should connect the requirement to the result: which data were used, who checked them, what changed, and when.

    This third job is where many ESG efforts fail. The work may have happened, but the trail is scattered across inboxes and spreadsheets. When a regulator, auditor, customer, or court asks later, “we did it” is weaker than a dated record showing how the company knew, decided, acted, and checked.

    What makes compliance an ESG subject?

    All companies have compliance duties. ESG compliance is the slice attached to environmental, social, and governance obligations. On the environmental side, it includes permits, waste and pollution controls, product restrictions, building-performance requirements, and emissions measurement and disclosure. On the social side, it includes workplace safety, labour standards, human-rights due diligence, and rules against forced labour in supply chains. On the governance side, it includes truthful disclosure, documented oversight, controls over data and claims, and a process for finding and correcting failures.

    Disclosure is the part readers now meet most often. Under the CSRD as amended by the Omnibus, the in-scope threshold is more than 1,000 employees and more than €450 million in turnover, and double materiality remains the gateway: the company tests both its effects on people and the environment and the financial effects those issues can have on the company. BC ESG’s CSRD double-materiality guide works through how that test is applied.

    California shows why status belongs in the register. SB 253’s Scope 1 and 2 reports are due November 10, 2026. SB 261, its climate-risk reporting sibling, is under a Ninth Circuit injunction. Treating both as simply “California climate compliance” would miss the operative difference: one duty is live; the other is paused. The California climate disclosure playbook follows those mechanics.

    The SEC gives the same lesson from the opposite direction. Its 2024 climate disclosure rules never took effect, and rescission has been proposed but is not final. A headline saying a rule is coming, stayed, withdrawn, or proposed for rescission is not enough. Compliance begins with the legal status and the exact obligation, not the loudest summary of it.

    The family of words around compliance

    Regulatory compliance is the part owed under laws, regulations, permits, listing rules, and regulator-made requirements. It answers the question, “What does an authority require of us?” BC ESG’s compliance frameworks map sorts those requirements by who issues them, what compels the company to follow them, and where they overlap. Regulatory compliance is usually the non-negotiable layer, although contracts and customer requirements can be just as commercially binding.

    Corporate compliance is the company’s internal system for handling those obligations. It includes the register, accountable owners, procedures, training, monitoring, escalation, investigation, and correction. It also covers internal rules the company adopts for itself, such as approval limits and codes of conduct. If regulatory compliance names the external duty, corporate compliance is the machinery that makes sure the duty is not left to chance.

    Trade compliance concerns what crosses borders. It includes customs classification and valuation, export controls and sanctions, import restrictions, product rules, origin claims, and evidence that goods were not made with prohibited labour practices. In ESG work, trade compliance is where a supply-chain promise meets a shipment: a company may have a responsible-sourcing policy, but the practical questions are what the goods are, where they came from, who handled them, and what documents prove it.

    Compliance risk is the exposure created by the gap between what is owed and what the company can actually do or prove. The gap can be ignorance, weak data, a missed deadline, a control that exists only on paper, or a public claim that runs ahead of the evidence. BC ESG’s ESG risk explainer treats that exposure operationally: what can hurt the company, how badly, and what reduces it.

    Compliance, governance, and risk are not synonyms

    These three words work together, but they do different jobs. Compliance asks, “What must we do, and can we show that we did it?” Governance asks, “Who decides, who oversees the decision, and who is accountable when the answer changes?” Risk asks, “What could happen, how serious would it be, and how much uncertainty can we accept?”

    A board can govern well and still discover a compliance failure. A risk assessment can identify a danger without creating a legal duty to use one particular control. A company can satisfy a filing rule and still carry a large physical or transition risk that no filing removes. Keeping the words separate prevents a common mistake: treating a completed disclosure as though it were a decision, or treating a risk workshop as though it were evidence of compliance.

    The connection is just as important. Governance sets ownership and escalation. Risk work helps decide where limited attention goes first. Compliance supplies the fixed points—the duties that must be met whether or not they rank highest in a workshop. Tonight’s companion piece, Risk Management Through ESG and Compliance, takes the board-level view of how those pieces fit together.

    What being compliant looks like week to week

    In a functioning company, compliance is mostly unglamorous maintenance. Each obligation has a named owner. The source data have a known home. Calculations can be traced. Deadlines sit on a calendar early enough for review. Exceptions are recorded rather than quietly worked around. When a rule changes, someone updates the register, the procedure, and the evidence request—not just a slide.

    A useful obligations register usually records the authority and requirement, the entities and activities covered, the threshold or trigger, the due date or frequency, the internal owner, the control used to meet it, the evidence retained, and the status of any gap. A compliance check then compares that register with reality: What has changed? Which evidence is missing? Which deadline moved? Which claim in a report or sales document no longer matches the underlying record?

    That weekly discipline is the real difference between a programme and a scramble. The scramble begins when a filing date, customer questionnaire, audit, or border hold reveals that nobody owns the answer. The programme is slower in appearance and faster in fact, because the answer already has a place to live.

    What compliance is not

    Compliance is not a certificate on the wall. A management-system certificate or assurance statement may be useful evidence for a defined scope and period, but it does not settle every law, site, product, or claim outside that scope. Nor is compliance only the legal department’s problem. Lawyers can interpret duties and defend decisions; operations produce the emissions, purchasing holds the supplier records, finance controls the reporting process, and communications makes many of the claims that later need support.

    It is not one-and-done, because both the company and the rulebook move. A new facility, acquisition, supplier, product, market, or public claim can create a duty that did not exist last year. A rule can also narrow, pause, or change form. And compliance is not the same as being responsible in the broad moral sense. A company can meet a minimum legal requirement and still make a poor environmental or social choice. Compliance is the floor that can be tested, not the whole judgement of whether the company behaved well.

    The plain test is this: pick any ESG statement the company makes and ask three questions. Which rule or commitment sits behind it? Who owns meeting it? What record would persuade a sceptical outsider? If those answers are clear, the word “compliance” is doing real work. If they are not, it is still just vocabulary.

  • Risk Management Through ESG and Compliance: The Governance Version

    Risk Management Through ESG and Compliance: The Governance Version

    Operational risk management asks one question: what breaks? It inventories hazards, scores likelihood against impact, assigns controls, and plans for the day the control fails. That discipline is necessary. It is not the whole of risk management, and for a growing class of exposures it is not even the main part.

    Governance risk management asks three different questions. What are we exposed to? — exposure the business has already taken on through its assets, markets, and public statements, whether or not anyone has scored it. What do we owe? — duties imposed from outside, by statute, regulation, contract, and listing rule, each with thresholds, dates, and a signature at the bottom. And who decides? — because when the risk is slow-moving, priced by other people, and disclosed in public, the decisions that matter are capital allocation, strategy, and disclosure, and those belong to the board.

    When the risks are ESG-shaped and the duties are compliance-shaped, risk management stops being a departmental function and becomes a governance function. This page is that version. For the operational read of ESG risk itself — what it means for a mid-size company’s day-to-day exposures — see ESG Risk, Explained. What follows is the layer above it: the same exposures, handled as matters of oversight and obligation.

    The ESG risk families, stated as governance objects

    Transition risk is the exposure created by other people’s decisions: carbon pricing, border adjustments such as the EU’s CBAM, technology substitution, shifting customer mandates. It reprices assets and order books before it interrupts a single operation, which is why it is a governance object — the available responses are strategic (exit, convert, reprice, disclose), not operational.

    Physical risk — flood, heat, water scarcity, storm — is operational at the point of impact, but governance in its timing. The horizons run past management tenure and past most planning cycles; the load-bearing decisions are where to site, what to harden, and what to insure or walk away from, taken years before the event.

    Liability and litigation risk is the family boards most often underweight. Greenwashing claims, disclosure liability, and directors’-duties arguments share one feature: the exposure is created by the company’s own statements. A sustainability claim that outruns the underlying data is not a communications problem; it is a contingent liability drafted by the marketing department.

    Disclosure risk is the newest family and the least intuitive. Once a company reports under a framework, the report itself becomes a risk surface: numbers that cannot be traced to a control, estimates presented as measurements, inconsistency between the sustainability statement and the financial statements. Assurance failure and restatement sit here — events that damage credibility with regulators and investors long after the operational facts are fixed.

    None of these four is managed at the point of failure. All four are managed at the point of decision, which is the definition of a governance object.

    The compliance-duty layer: where exposure becomes obligation

    Exposure is a judgement; a duty is a fact. The compliance layer is where ESG risk acquires thresholds, deadlines, and named accountable officers — and it is currently moving in opposite directions on different sides of the Atlantic, which is itself a governance problem.

    The EU: double materiality as a risk process. Under the CSRD as amended by the Omnibus I directive (in force March 2026), mandatory sustainability reporting now applies to undertakings with more than 1,000 employees and more than €450 million in net turnover, with first reports covering financial year 2027 and published in 2028. The scope narrowed; the method did not. The double materiality assessment — testing each topic for impact materiality (the company’s effects on people and environment) and financial materiality (the topic’s effects on the company) — remains the gateway, and it is, in substance, a board-level risk assessment with an audit trail. Boards that treat it as a reporting exercise miss what it is: the documented process by which the company decided what its material risks are. BC ESG’s CSRD double materiality implementation guide works through the mechanics for a real-estate portfolio.

    California: one duty live, one duty paused. SB 253 requires US companies with more than $1 billion in revenue doing business in California to report Scope 1 and 2 emissions, with first reports due November 10, 2026 and Scope 3 following on CARB’s schedule. It is live and enforceable. Its sibling, SB 261 — biennial climate-related financial risk reports for companies above $500 million — has been under a Ninth Circuit injunction since November 2025, with no enforcement date currently set. Same legislature, same subject matter, opposite legal status: a board register that tracks topics rather than legal status will get at least one of these wrong. The full mechanics are in the California climate disclosure playbook.

    The SEC: a withdrawn rule is not a withdrawn duty. The SEC’s 2024 climate disclosure rules never took effect — stayed in April 2024, undefended from March 2025, and formally proposed for rescission on May 29, 2026, with the rescission not yet final. The operative federal frame is therefore the older one: the Commission’s 2010 interpretive guidance on climate disclosure and the general materiality doctrine. The governance lesson generalises. The absence of a specific rule removes a checklist; it does not remove the liability that attaches to material misstatements, and it does not stop lenders, insurers, and customers from asking the same questions contractually.

    The governance machinery

    Machinery is what separates a governance treatment from a slide deck. Four components do most of the work.

    Named board ownership. A committee charter — audit, risk, or a dedicated sustainability committee — names ESG and climate risk explicitly, with a reporting line and a calendar. Risk that belongs to every committee belongs to none, and “the full board oversees ESG” usually means no director has read the register.

    A board-level risk register. Not the operational register rolled up, but a shorter, larger document: each entry carries an owner, a time horizon, a velocity (how fast it can crystallise), and — the field most registers omit — the decision it forces and the date by which that decision must be taken. A register entry that forces no decision is commentary.

    The three lines, kept honest. In the IIA’s model, management owns the risk (first line), risk and compliance functions set method and challenge (second line), and internal audit provides independent assurance (third line). ESG reporting failures are disproportionately second-line failures: the number was compiled by the first line, published on schedule, and challenged by no one with the standing to stop it. Governance means the challenge function exists before publication, not after restatement.

    Pay linkage, with its own risk controls. Where ESG metrics enter executive compensation, the risk process acquires an enforcement mechanism — and a new exposure, because a badly specified metric will be optimised exactly as written. The verification-before-payout discipline matters as much as the weighting; BC ESG’s board oversight and ESG-linked pay blueprint sets out the architecture, and KPI design covers how the metrics themselves should be built. Underneath all of it sits the inventory: governance decisions are only as good as the emissions data beneath them, which is why the one rule that sorts Scope 1, 2 and 3 is a governance topic and not merely an accounting one.

    The operational sibling — and where the line sits

    None of this replaces operational risk management. Hazard identification, control design, incident response, continuity planning: when the question is what breaks and how the business keeps running, the operational discipline is the answer, and Continuity Hub’s risk management anchor, in plain English, is the companion treatment of exactly that layer. The governance version begins where operations ends — with exposure the business has already chosen, duties it already owes, and decisions only the board can make. Organisations get into trouble when they run one of these disciplines and call it the other: a beautiful operational register with no board sight of the disclosure duty, or a board pack full of exposure with no controls underneath it.

    What good looks like

    • A committee charter names ESG and climate risk explicitly, with a reporting calendar the board actually keeps.
    • The double materiality assessment is dated, minuted, and refreshed on a set cycle — filed as the risk decision it is, not as reporting paperwork.
    • Every published ESG number traces to a named owner and a control, and the second line has challenged it before publication.
    • The register records legal status per duty — live, stayed, proposed, rescinded — not just the topic.
    • Pay-linked ESG metrics are verified before they pay out, and the clawback route is written down in advance.
    • The board sees the same register management sees. A summary of a summary is not oversight.

    The governance version of risk management is slower and less visible than the operational one. It produces fewer binders and more decisions. It is also where the liability sits — which is why, for ESG-shaped risks and compliance-shaped duties, it is the version the board has to own.

  • Scope 1, 2 and 3: The One Rule That Sorts Them

    Scope 1, 2 and 3: The One Rule That Sorts Them

    The same diesel truck can be Scope 1 for one company and Scope 3 for another, and neither company is wrong. Nothing about the truck changed. What changed is the relationship between the reporting company and the source of the emissions.

    That is the one rule underneath the GHG Protocol’s three scopes, and it is the rule most summaries leave out. The GHG Protocol classifies emissions according to the reporting organisation’s boundaries and its relationship to the source. It does not classify them simply by whether an activity happens inside or outside the organisation’s premises. A source can sit in your yard and still not be yours to report as Scope 1; a source inside a supplier’s factory on another continent can still belong in your inventory, as Scope 3.

    Sort by postcode instead of by relationship, and the inventory will misfile sources and miss whole categories.

    What the GHG Protocol is

    The GHG Protocol is the widely used international framework for measuring and reporting greenhouse gas emissions, developed by the World Resources Institute (WRI) and the World Business Council for Sustainable Development (WBCSD). Its Corporate Accounting and Reporting Standard — the Corporate Standard — defines the three scopes for a company-level inventory; a separate Corporate Value Chain (Scope 3) Standard sets out the Scope 3 categories in full, and separate Scope 2 guidance covers purchased energy.

    The framework’s job is attribution, and the GHG Protocol’s own summary is compact: Scope 1 emissions are direct emissions from owned or controlled sources; Scope 2 emissions are indirect emissions from the generation of purchased energy; Scope 3 emissions are all indirect emissions not included in Scope 2 that occur in the value chain of the reporting company, upstream and downstream.

    The same truck, walked through all three scopes

    Take one delivery truck making one delivery to your facility, in three arrangements.

    Your truck, your diesel. Your company owns and operates the truck, and it burns diesel your company bought. The combustion happens in a source you own or control, so those emissions are your Scope 1 — direct emissions.

    Their truck, your delivery. Now a third-party logistics provider makes the same delivery in its own truck, burning its own diesel, and you pay for the transportation service. For the provider, that diesel is its Scope 1, for exactly the reason above. For you, the same physical emissions are Scope 3 — specifically upstream transportation and distribution, Category 4 of the Scope 3 Standard, because you purchased the transport service. Same truck, same fuel, same road. The scope moved because your relationship to the source moved: owner-operator in the first case, customer in the second.

    Your truck, bought electricity. Finally, replace the diesel truck with an electric one your company owns and charges at your depot on purchased grid electricity. The truck produces no exhaust, but the electricity was generated somewhere by someone else, and you bought and consumed it. The emissions from generating that purchased electricity are your Scope 2. The charging did not become Scope 1 because the depot is your premises, and it did not become Scope 3 merely because the power station is off-site. Purchased energy consumed by the reporting company has its own scope.

    Three arrangements, three scopes, one vehicle — and the premises determined none of them.

    The three scopes, defined cleanly

    Scope 1: direct emissions from sources you own or control

    Scope 1 covers direct greenhouse gas emissions from sources within your organisational boundary — sources the reporting company owns or controls. In practice these come from stationary combustion (boilers, furnaces, generators), mobile combustion (company vehicles), process emissions from reactions in your own operations, and fugitive emissions such as refrigerant leaking from equipment you operate. The test is the boundary, not the building: if the source is yours under your chosen consolidation approach, its direct emissions are Scope 1 wherever it happens to be.

    Scope 2: indirect emissions from energy you buy and consume

    Scope 2 covers the emissions from generating the electricity, steam, heating and cooling your organisation purchases or acquires and consumes. The emissions physically occur at the generator’s facility; they are attributed to you because the energy was produced for your consumption. Scope 2 is reported two ways where the guidance applies: location-based, using the average emissions intensity of the grid where consumption occurs, and market-based, reflecting the contractual instruments — supplier contracts, power purchase agreements, energy attribute certificates — the company has actually bought. Our corporate carbon footprint calculator works through a location-based estimate so readers can see the mechanics on their own numbers.

    Scope 3: all other indirect emissions in your value chain

    Scope 3 covers every other indirect emission in the reporting company’s value chain, upstream and downstream, that is not already in Scope 2. You do not need to own the supplier’s factory, operate the carrier’s trucks, or control how a customer uses your product for the associated emissions to fall in your Scope 3 inventory. The Scope 3 Standard organises them into 15 categories: eight upstream, from purchased goods and services through employee commuting and upstream leased assets, and seven downstream, from downstream transportation through use and end-of-life treatment of sold products to investments. Not every category is material to every company; the work is deciding which are relevant and saying why the rest are not. For the hardest part — getting real data out of suppliers rather than spend-based proxies — see our field guide to Scope 3 supplier data.

    Why the premises mistake happens, and what it breaks

    The premises version is seductive because it is easy to draw: everything inside the fence is “ours,” everything outside it is “theirs.” For a single-site company with no leased assets or outsourced logistics, it can even produce a roughly right answer by accident. Then reality arrives — a leased warehouse, an outsourced delivery contract, a tenant in a building you own — and each separates location from control. Three kinds of damage follow:

    • Misclassification. Sources the company controls off-site get missed or pushed into Scope 3, and on-site sources belonging to tenants or contractors get pulled into Scope 1. The totals can look plausible while the attribution underneath is wrong.
    • Missed Scope 3 categories. If “not our premises” means “not our inventory,” the value chain disappears. Purchased goods, third-party freight, business travel, commuting, and the use of sold products are exactly what a premises test discards — and they are categories disclosure regimes increasingly ask about, as our guide to CSRD double materiality works through for real estate portfolios.
    • Double counting inside the inventory. A source filed twice — once by location and once by contract, when landlord and tenant both report the same boiler as Scope 1 — inflates one company’s inventory. That differs from the overlap the Protocol expects between companies: the provider’s Scope 1 and its customer’s Scope 3 legitimately describe the same physical emissions from two positions in one chain, which is why inventories should not be added together as if every reported tonne were separate. Overlap across inventories is by design; duplication within one is an error.

    The facility-level consequences — base building against tenant, landlord against occupier — are worked through in our carbon accounting guide for commercial facilities.

    Organisational boundaries: the choice that sits underneath

    Before any source can be sorted, the company has to say where the organisation ends. Under the equity share approach, a company accounts for emissions from an operation according to its share of economic interest in it. Under the control approaches, it accounts for all emissions from operations it controls — control defined in financial or operational terms — and none from operations it does not control, whatever its stake.

    Two consequences matter. First, the same joint venture can legitimately land in different places in two companies’ inventories, because each drew its boundary by its own stated approach. Second, leased assets are the standing edge case: whether a leased building’s or vehicle’s emissions fall in Scope 1 and 2 or in Scope 3 depends on the approach chosen and the lease structure — which is why the boundary decision must be documented and applied consistently, not improvised source by source.

    A three-question sorting checklist

    For any source in front of you, ask in this order:

    1. Do we own or control the source itself? If yes, its direct emissions are Scope 1 — the boiler’s gas, the truck’s diesel, the refrigerant that leaked from your chiller. If no, move on; do not stop here just because the source is on your site.
    2. Did we buy the energy it produced? If the emission came from generating electricity, steam, heating or cooling your organisation purchased and consumed, it is Scope 2 — however far away the generator sits.
    3. Is it in our value chain because of something we bought, sold, leased, invested in, travelled for, or disposed of? If yes, it is Scope 3. Find the category — purchased goods, upstream transport, waste, use of sold products — and file it there, not in a residual “other” line.

    If a source fails all three, it is not in your inventory, and you should be able to say why in one sentence. If it passes more than one, the order is the tiebreak: control first, purchased energy second, value chain last.

    Sorting is the start, not the finish

    The scopes are a filing system, not a result. A correctly sorted inventory still has to be measured, evidenced, and turned into targets a board can govern — where indicator design earns its keep, as our framework for KPI design for ESG performance sets out, and where the count itself should not be confused with the instruments traded against it, a distinction our explainer on carbon credits and the GHG Protocol keeps in view.

    None of that later work survives a wrong sort at the start. Draw the boundary, state the approach, and ask whose source it is before you ask where it sits. The truck will tell you the rest.

  • Designed Below the Limit, Built Above It: How Procurement Moves a Building’s Carbon Number

    Designed Below the Limit, Built Above It: How Procurement Moves a Building’s Carbon Number

    The short answer

    Yes — a building calculated below its embodied-carbon limit at design can finish above that limit once it is built. A 2026 Finnish study from VTT and Aalto University found that choosing high-carbon product alternatives over average ones, inside the same product groups the design already specified, may raise a building’s production-stage (A1–A3) emissions by 20 to 30%. The design did not change. The structure did not change. What changed was which supplier’s version of the same board, bar, and beam actually arrived on site.

    That is the gap this research measures for the first time: the distance between the building as calculated and the building as procured.

    Where the swing lives

    The researchers took a reference apartment building — five storeys, 1,370 m² in Helsinki, modelled in hybrid, timber, and concrete versions — and re-ran its product-stage emissions using real environmental product declarations (EPDs) for the highest- and lowest-carbon products inside each category. An average of five EPDs per category, all to the EN 15804+A2 standard.

    The spreads inside a single product group are wide:

    • Steel rebar: the high-carbon EPD runs +90% against the average; the low-carbon option runs −29%.
    • Stone wool insulation: +100% at the top of the range, −83% at the bottom.
    • Gypsum board: +53% / −56%.
    • Sawn timber: +60% / −27%.
    • Concrete: Finland’s low-carbon classification cuts C30/37 from 255 to 178.5 kgCO2e per cubic metre, and C35/45 from 315 to 220.5.

    Rolled up to the whole building, high-carbon choices inside the specified groups added 20% (hybrid), 30% (timber), and 24% (concrete) to A1–A3 emissions versus average products. Low-carbon choices cut 17 to 23%. In other words, procurement holds a swing of roughly half the production-stage footprint, in both directions, without touching the design.

    And that understates it. Building services — the single largest contributor in the reference building, at 30 to 40% of A1–A4 emissions — had to be left out of the variation entirely, because too few EPDs with genuinely lower-carbon alternatives exist yet for equipment like elevators and air handling units. When those declarations mature, the procurement swing gets bigger, not smaller.

    The second front: transport and the site itself

    Modules A4 and A5 — getting materials to site and running the site — swung wider still. Across transport, construction machinery, and site energy use, the study’s low-carbon scenario came in 58% below the average scenario, and its high-carbon scenario 152% above it.

    The widest single lever was the electricity the site runs on: hydro power versus the standard Finnish production mix differed by a factor of 21, and a grey residual mix ran another factor of five above the average. Transport told the same story in miniature — electric trucks at 6 tonnes of CO2e for the reference project, biodiesel at 29, diesel at 59. None of these are design decisions. All of them are made by whoever plans logistics and site operations, usually after the carbon calculation is already filed.

    Why Finland’s rule makes this a compliance problem, not a curiosity

    The Finnish Building Act does something most regimes do not: it mandates the embodied-carbon calculation, and tests it against the legal limit value, only after construction, on the building as built. The European EPBD, by contrast, asks for the whole-life carbon assessment during design.

    Under an as-built test, the sequence inverts. The design team calculates a compliant building. Procurement then makes the final product choices — in Finnish practice, routinely, inside the design framework — and the emissions are realized on site. If those choices drift high, the building crosses its limit at exactly the moment nothing can be redesigned. The failure is discovered when it is permanent.

    Any jurisdiction moving toward limit values inherits some version of this exposure. The specific trigger differs — an as-built assessment, a tightening limit at a later permit stage, an EPD-based specification audited at completion — but the mechanism is identical: the number is not final when the design is. It is final when the last substitution is approved.

    The two moves the study recommends

    The authors’ recommendations are plain, and both are cheaper than the failure they prevent.

    Design with a safety margin. If product choice alone can move A1–A3 by up to 30%, a design that lands at 97% of the limit has not complied — it has gambled. The margin belongs in the calculation from the start, sized to the spread of the products the specification actually allows.

    Steer the footprint while it can still be steered. The study calls for better data collection and visibility during construction, plus a post-construction evaluation calculation. In practice that means treating substitution as a compliance act: a specified product swapped for an “equivalent” is checked against its EPD and the running total before it is approved, not discovered after it is installed. The carbon ledger stays open and visible for as long as the building is still changeable — which is precisely the procurement window.

    Read the numbers the way the authors ask you to

    This is one Finnish reference building, EPD samples are small, the site-operation figures were transplanted from two Norwegian cases, and the authors say plainly that their results are indicative rather than exact. What travels is not the third decimal place. What travels is the mechanism: inside every product group your specification already names, there is a high-carbon version and a low-carbon version, and the difference between them is large enough to decide whether a compliant design becomes a compliant building.

    The design sets the ceiling. Procurement decides whether the building stays under it.

    Source: Vainio-Kaila, T., van den Brink, R., Ala-Kotila, P., Lavikka, R., Nyqvist, R. “The effect of procurement and construction site decisions on the embodied carbon emissions of buildings: a Finnish perspective.” IOP Conference Series: Earth and Environmental Science 1672 (2026) 012051. VTT Technical Research Centre of Finland and Aalto University. Open access (CC BY 4.0).

  • The Data Center Oversight Act: What Operators Would Have to Put in Public

    The Data Center Oversight Act: What Operators Would Have to Put in Public

    A data center deal usually arrives in a community the same way: a codename, a closed session, and a nondisclosure agreement. A new federal bill proposes to reverse that order. The Data Center Oversight Act, introduced in the House on October 29, 2026 by Rep. Eugene Vindman of Virginia, would make the Energy Information Administration collect — and publicly report — a standard set of facts about every existing and proposed data center in the country. For developers and host communities alike, the practical question is simple: exactly what becomes public? Here is the checklist, as written.

    What is being proposed

    The Act would require the Energy Information Administration (EIA), within the Department of Energy, to collect and publicly report comprehensive information on both existing data centers and proposed developments. Operators submit the information; EIA publishes it.

    Status: this is an introduced bill, not law. It was introduced October 29, 2026, and has the long committee road in front of it. But disclosure bills like this one also move the market before they move Congress — the checklist below is already a fair preview of what host communities, journalists, and competitors will ask for in 2027 whether or not the bill passes.

    The disclosure checklist

    Under the Act, operators would have to report:

    • Ownership — who actually owns the facility.
    • Energy usage — expected or actual electricity consumption.
    • Water usage — expected or actual water consumption.
    • Ratepayer costs — the costs of serving the facility that may be passed on to utility ratepayers.
    • Nondisclosure agreements — whether the facility’s owners have signed NDAs with government officials.
    • Union labor — whether union labor was used in construction.
    • Sensitive proximity — whether the facility sits within 1,000 feet of a school, a national park, a hospital, or a home.

    Read the list as a community would. Energy and water are the resource questions every county hearing now runs on. The ratepayer-cost item goes at the subsidy argument directly: not what the facility pays, but what its presence costs everyone else on the grid. And the proximity item converts the most emotional local question — how close is this thing to where people live, learn, and recover — into a yes/no federal data point.

    The NDA item is the sharp edge

    Most of the checklist asks for numbers. The nondisclosure item asks for a fact about secrecy itself: not the contents of any agreement — the Act does not reach those — but whether one exists between the developer and government officials.

    That single yes/no changes local politics. Today, a resident who asks why a project was negotiated in private can be told nothing at all. Under the Act, the existence of the NDA is itself a disclosed, federally reported fact. Developers who treat confidentiality as the default opening move would be making that choice in public.

    What does getting it wrong cost?

    Entities that fail to report, submit incomplete information, or provide misleading information face penalties of up to $1 million per day.

    The structure matters as much as the number. The penalty covers three distinct failures — silence, incompleteness, and inaccuracy — and it runs per day, which means a disclosure problem is not a fine you budget for; it is a clock that runs until the filing is right. At that scale, disclosure stops being a communications task and becomes a compliance function with records, owners, and review — the same treatment environmental and financial reporting already get.

    This bill does not arrive alone

    The Oversight Act is Vindman’s third data-center measure of 2026. In October he introduced the Make Data Centers Pay Act, aimed at shielding households and small businesses from electricity costs driven by data-center demand. In August, the Smart Data Center Policy Act took up development near neighborhoods, schools, and parks. Read together, the three bills mark the shape of the federal argument: who pays, where it goes, and — with this Act — who has to say so, in public, in advance.

    The state and local layer is moving the same direction. Water and energy disclosure fights now attach to individual projects, and the physical-risk questions communities ask — water scarcity chief among them — have become standard diligence, not activism.

    What a developer or a host community should do now

    You do not need the bill to pass to use the checklist. For a developer, it is a pre-announcement inventory: for any live or proposed site, could you answer all seven items today, accurately, from records? Ownership structures, utility-service cost allocations, and construction-labor facts are easy to state early and hard to reconstruct under a per-day clock. For a host community, the checklist is the term sheet for your own questions — ask for these seven items in the first public session, while the answers are still cheap.

    The industry’s growth is not the controversy anymore. The controversy is whether the facts arrive before the concrete does. This bill’s answer is a form, filed with the EIA, where anyone can read it.

    Informational only — this article summarizes the Data Center Oversight Act as introduced on October 29, 2026, per the sponsor’s published summary and contemporary reporting; it is not legal advice, and a bill’s text and prospects can change. Sources: Office of Rep. Eugene Vindman (Oct 29, 2026); Nextgov/FCW, “Tech bills of the week” (Oct 30, 2026).

  • Portland Building Compliance: Live Ch. 17.104 (April 22), OR HB 3409 & 2050 Carbon Proposal

    Portland Building Compliance: Live Ch. 17.104 (April 22), OR HB 3409 & 2050 Carbon Proposal

    Updated: November 14, 2026 — Refreshed to reflect current statutory cycles, verification rules, and post-election regulatory posture.

    Short answer: Portland building compliance involves two distinct legal layers today — plus one closely watched legislative proposal. On the active, enforceable ledger, Portland City Code Chapter 17.104 (administered since 2015 by Portland’s Bureau of Planning & Sustainability) requires annual April 22 ENERGY STAR Portfolio Manager benchmarking for covered commercial buildings >=20,000 sq ft, operating alongside Oregon’s active statewide HB 3409 / OAR 330-300 Building Performance Standard.

    Meanwhile, Ordinance 2026-377 (Climate and Health Standards for Buildings Code) — continued to City Council’s Housing and Permitting Committee December 1 docket — remains a proposal, not enacted law. It would replace Ch. 17.104 with 20% five-year GHGI reductions reaching zero in 2050 (without offsets or RNG), expand annual June 1, 2028 reporting to residential 4+ unit buildings >=20,000 sq ft, and attach a $380/MTCO2e carbon impact fee. Building owners should comply with active April 22 Ch. 17.104 and Oregon HB 3409 duties today while monitoring Council adoption.

    Statutory Status at a Glance
    • Live City Law (Ch. 17.104 — April 22): Commercial buildings >=20,000 sq ft report energy use annually by April 22 via Portfolio Manager; excludes residential, warehouses, K-12, industrial, and places of worship.
    • Live State Law (OR HB 3409 / OAR 330-300): Covers non-residential Tier 1 >=35,000 sq ft under ODOE EUI targets and pulls commercial/institutional/multifamily >=20,000 sq ft (and warehouses/hotels excluded locally) into Tier 2 state reporting.
    • Proposed Ord. 2026-377 (Pending): Draft 20% 5-year GHGI step-downs starting 2030 toward net-zero 2050, no offsets/RNG, $380/tCO2e ratcheting fee, non-passthrough protection, regulated affordable housing exemption, and tenant heat/ventilation disclosures from 2028.
    • Clean Baseline Continuity: Accurate April 22 Portfolio Manager submissions under live Ch. 17.104 preserve verified baseline EUI records required for Oregon HB 3409 and any enacted city carbon step-down.
    Print-First Compliance Brief

    Download the Portland Ch. 17.104 + 2050 Proposal Reference

    2-page Print-First PDF separating active Portland Ch. 17.104 April 22 duties and Oregon HB 3409 rules from proposed Ord. 2026-377.

    Reconciling Live April 22 Reporting, Oregon HB 3409 & Draft Ord. 2026-377

    A warehouse or multifamily asset manager inside Portland can fall into an unexpected blind spot if checking only city code: while Portland Ch. 17.104 currently excludes multifamily residential and warehouse structures, Oregon statewide HB 3409 explicitly captures >=35,000 sq ft non-residential Tier 1 assets (including covered warehouse/storage classifications depending on ODOE grouping) and extends Tier 2 benchmarking/O&M reporting to multifamily and institutional buildings >=20,000 sq ft starting in 2028.

    If Council adopts draft Ordinance 2026-377, Portland’s local scope expands from purely commercial reporting into binding 5-year emissions intensity step-downs accompanied by tenant protections — bar cost passthroughs, relocation tenant impact plans, and Jan/June 2028 climate-and-health disclosures.

    • Do Not Confuse Proposals With Active Penalties: Zero $380/tCO2e fines apply today — active enforcement governs annual April 22 Ch. 17.104 filings and statewide ODOE HB 3409 timelines.
    • Track Both Council & ODOE Calendars: Maintain PGE / NW Natural Portfolio Manager utility aggregation uninterrupted across city April 22 and state cycles.
    Instrument & StatusCovered BuildingsDeadlines / TargetsCore Obligation
    Portland Ch. 17.104 (LIVE)Commercial >=20,000 sf (no res/whse/K-12)Annual April 22Portfolio Manager energy reporting
    Oregon HB 3409 / OAR 330-300 (LIVE)Tier 1 nonres >=35k sf; Tier 2 >=20k/multi2028 Tier 1 EUI / Tier 2 dataODOE EUI targets & O&M / benchmarking
    Portland Ord. 2026-377 (PROPOSED)Comm + res >=4 units (>=20k sf)Draft 2028 Rpt -> 2030–2050 20% cuts$380/tCO2e fee (pending Council decision)
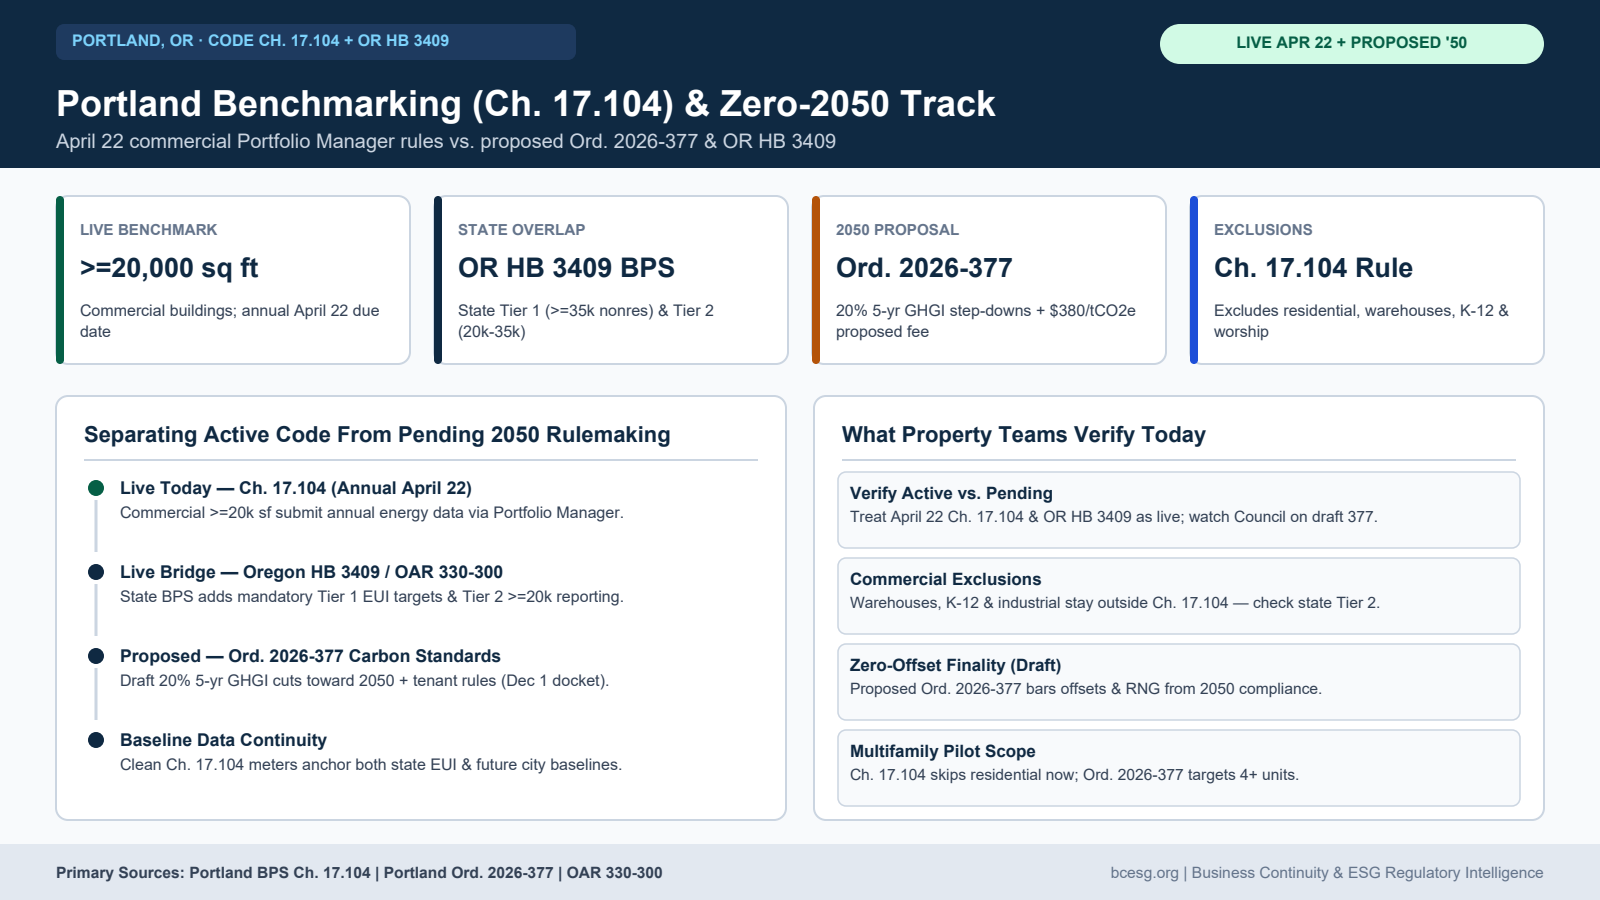
    Compliance architecture distinguishing Portland's live Chapter 17.104 April 22 commercial benchmarking from proposed Ordinance 2026-377 and statewide Oregon HB 3409 BPS.
    Portland compliance landscape: active annual April 22 reporting under Ch. 17.104, statewide Oregon HB 3409 Tier 1/2 BPS rules, and proposed Ord. 2026-377.

    Compliance Execution Checklist

    StepOwner / TeamAuditable Deliverable
    1. April 22 Ch. 17.104 FilingProperty OpsSubmit annual PGE/NW Natural energy data in Portfolio Manager for >=20k comm.
    2. HB 3409 State Cross-CheckOregon Compliance LeadConfirm whether asset triggers ODOE Tier 1 (>=35k) EUI or Tier 2 (>=20k) rules.
    3. Watch Dec 1 Ord. 2026-377Legal / SustainabilityMonitor Portland City Council markup for $380/tCO2e fee & 2028 multifamily rules.
    Field & Print Package

    Keep This Portland, OR Compliance Checklist Handy

    Download the formatted 2-page PDF reference brief or pull the structured Markdown edition for internal compliance documentation.

    Frequently Asked Questions

    What Portland building energy law is actually enforceable right now?

    Portland City Code Chapter 17.104 (annual April 22 ENERGY STAR Portfolio Manager reporting for commercial buildings >=20,000 sq ft) and Oregon's statewide HB 3409 / OAR 330-300 Building Performance Standard are live today. Ordinance 2026-377 (zero-by-2050 GHGI step-downs) remains a pending proposal.

    Are Portland multifamily apartment buildings required to benchmark today?

    Under existing Ch. 17.104, residential buildings are excluded from Portland city reporting, though multifamily assets >=35k/20k fall into Oregon's statewide HB 3409 Tier 2 cohort (starting 2028) and proposed Ord. 2026-377 would cover >=4-unit buildings >=20,000 sq ft.

    Primary Authorities & Official Resources

    Informational notice: This guide summarizes enacted statutes, regulations, or pending legislative records from the primary authorities linked above as of November 14, 2026. It is not legal, accounting, or licensed engineering advice.

  • How Do Lenders Finance Homes That Aren’t Financeable Yet?

    How Do Lenders Finance Homes That Aren’t Financeable Yet?

    A lender looking at an inefficient home faces a simple fork: lend against the building as it stands, or lend against the building it could become. A new cross-industry white paper, The Trillion-Dollar Housing Transition, published by the Sustainable Real Estate Forum (SREF) in October 2026, argues the second option is where the market now has to learn to work — and that the shortage holding it back is not money. It is the ability to originate, underwrite and execute credible transition pathways at scale.

    The paper was written with contributions from GlobalABC, RICS, the European Mortgage Federation (EMF-ECBC), PATRIZIA, Optiml, pbb Deutsche Pfandbriefbank and INREV, and SREF will distribute it in the Blue Zone at COP31 in Antalya, Türkiye. Its lending chapter, from pbb, reduces the lender’s job to a three-part test: finance the cure, price the residual risk, and withdraw only when neither is credible.

    What is SREF actually claiming?

    The claim is that affordable housing and climate action have to be delivered together, and that capital is not the binding constraint on doing it. “A home that is cheap to build but costly to cool, unsafe in floods or heatwaves, or dependent on high-carbon materials is not affordable over its lifetime,” the paper states. The bottleneck, in SREF’s account, sits one step earlier than the money: in whether the market can produce enough well-evidenced, underwritable retrofit and building pathways for the capital to attach to.

    The scale behind that claim is large by any measure. UN-Habitat estimates that by 2030 three billion people will need access to adequate housing — around 96,000 new affordable and accessible homes every day. Buildings’ operational emissions reached 9.9 GtCO₂ in 2024 and, according to UNEP, would need to fall by 56% by 2030 to align with a net-zero pathway. Roughly 80% of growth in building floor area through 2030 is expected in emerging and developing economies, where underwriting capacity is thinnest.

    Where does the “trillion-dollar” figure come from?

    “Trillion-dollar” is the paper’s framing of the overall scale, not a single line item. SREF’s founder and CEO, Peter Panayi, puts it this way: “The housing transition is a trillion-dollar challenge, but it is also a trillion-dollar opportunity.” The hardest number underneath the framing comes from UNEP: cumulative investment in building energy efficiency needs to reach around USD 5.9 trillion by 2030, compared with roughly USD 2.3 trillion invested between 2015 and 2024.

    The investor side of the ledger supports the “capital is available” half of the argument. €117 billion was raised for non-listed real estate in 2025, and 87% of surveyed managers expect the amount raised to increase over the next two years. INREV estimates Europe needs more than two million new homes a year — around 650,000 more than it builds today — requiring about €153 billion of additional investment each year. The question the paper presses is not whether that money exists. It is whether lenders can tell, home by home, which transition plans deserve it.

    What does “finance the cure” mean in practice?

    It means the lender’s first question about a poor-performing home changes. Instead of asking whether the asset is financeable today, the lender asks whether it can become financeable through a pathway that is credible, funded and capable of being monitored. As Lara Knapwost, Head of ESG at pbb Deutsche Pfandbriefbank, writes in the paper: “Real estate transition is not primarily about buildings that are already efficient and financeable today. The task for lenders is to identify the assets that can become financeable through a credible, funded and monitorable pathway, and to actively support them.”

    Each of those three adjectives does work. Credible means the retrofit or improvement plan is technically real for that building, not a generic pledge. Funded means the money for the works is actually assembled, including any subsidy or affordability support the household needs. Monitorable means the lender can check, over the life of the loan, whether the pathway is being delivered. A plan that fails one of the three is not a cure — it is a hope, and the test says not to price it as one.

    This is where the desk work already familiar to BC ESG readers connects. Deciding which measures come first in an existing building is the problem the Retrofit Priority Stack for Existing Buildings works through; the SREF test adds the lender’s side of the same table — which of those stacked measures, properly sequenced and funded, turns an unfinanceable asset into a lendable one.

    How should lenders price the residual risk that remains?

    Even a well-funded cure leaves risk behind: the works may underperform, energy prices and policy may move, and some homes will still sit below standard at the end of their pathway. The paper’s second instruction is to price that residue openly rather than pretend the cure erased it — or use it as a reason to refuse the loan outright.

    The valuation profession is where this pricing is supposed to become visible. RICS and EMF-ECBC argue that transition risk should become a material input to property valuation where it is supported by evidence. “Where transition risk is material and evidenced, valuers should be supported to reflect it,” says Sander Scheurwater, Head of Benelux at RICS. “The market’s ability to price both action and inaction will be central to the housing transition.” His colleague Gina Ding, RICS Head of Public Affairs Europe, describes the machinery: “Standards create the common language, data creates the evidence, and skilled valuers turn that evidence into professional judgement. When valuation is transparent, capital can tell apart the homes that need investment from those where investment protects value.”

    Pricing inaction matters as much as pricing action. A lender who prices only the risk of a retrofit pathway, and never the risk of holding a book of homes with no pathway at all, will systematically make the wrong call — the stranded-asset end of transition risk arrives through the loans that were never restructured, not just the ones that were. Jennifer Johnson, Deputy Secretary General of EMF-ECBC, ties the threads together: sustainability, valuation and mortgage finance have to align, with a robust understanding of how energy performance relates to property value and financial risk.

    Why can a credible plan still fail to deliver?

    Because a spreadsheet is not a building site. PATRIZIA and Optiml show that a portfolio can have a technically credible decarbonisation plan and still fail to deliver it — because contractors are unavailable, permits take too long, grid capacity is constrained, or households cannot absorb the cost. Nico Dehnert, co-founder of Optiml, is blunt about the substitutes: portfolios “will not be delivered through ESG reports, generic benchmarks or static plans,” but through “credible, investable pathways that connect building reality, financial goals, affordability and execution constraints.”

    So underwriting a pathway means underwriting its delivery chain, not just its engineering. Shreya Sheth of PATRIZIA calls the standard “decision readiness”: multiple investable pathways compared through a common financial and transition logic, so when one route blocks — a permit stalls, a contractor shortage bites — the financing can move to another route instead of dying.

    What do lenders need before they can do this at scale?

    The paper’s closing chapter, from INREV, answers with an Institutional Housing Compact: institutional capital can scale where three conditions hold. Policy must be stable, so a pathway underwritten today is not stranded by a rule change tomorrow. Affordability obligations must be explicitly funded, rather than silently loaded onto borrowers or lenders. And evidence must be common from asset to fund, so risks, returns and outcomes stay comparable as a home’s data travels up into a portfolio. “Capital follows the compact,” writes Jeff Rupp, INREV’s Director of Public Affairs: “stable rules, funded affordability and evidence that survives from asset to fund.”

    That evidence condition is the one lenders control most directly. The discipline of assembling climate and continuity evidence a lender can actually rely on is covered in BC ESG’s Lender and Investor Evidence Pack, and the wider lending and disclosure context sits in ESG in Banking and Investment: Risk, Lending, and Disclosure. GlobalABC’s opening chapter makes the matching point at country level: global commitments only convert into housing when they become country-owned delivery systems.

    And withdrawal? The test’s third clause is deliberately narrow: a lender withdraws only when neither side works — no credible cure can be financed and the residual risk cannot be honestly priced. It is the last resort of the test, not its default.

    Frequently asked questions

    What is The Trillion-Dollar Housing Transition?
    It is a white paper published by the Sustainable Real Estate Forum (SREF) in October 2026, with contributions from GlobalABC, RICS, EMF-ECBC, PATRIZIA, Optiml, pbb Deutsche Pfandbriefbank and INREV. It argues that affordable housing and climate action must be delivered together, and it will be distributed in the Blue Zone at COP31 in Antalya, Türkiye.

    Why does the paper say capital is not the constraint?
    Because the investment need — UNEP estimates cumulative building energy-efficiency investment of around USD 5.9 trillion is needed by 2030 — sits alongside demonstrated investor appetite, including €117 billion raised for non-listed real estate in 2025. The paper argues the binding limit is the market’s ability to originate, underwrite and execute credible transition pathways at the scale the capital requires.

    What is the lender’s three-part test in the paper?
    From pbb Deutsche Pfandbriefbank’s chapter: finance the cure, price the residual risk, and withdraw only when neither is credible. In practice: first ask whether a home can become financeable through a credible, funded and monitorable improvement pathway; then price whatever transition risk remains, transparently, through valuation; and treat withdrawal as a last resort.

    What does “residual risk” mean for a home that has a retrofit plan?
    It is the transition risk left over after the planned works: underperformance of the measures, energy-price and policy movement, and any gap between the home’s end state and the standard the market will expect. RICS argues valuers should reflect that risk in valuations where it is material and evidenced — alongside the risk of inaction, which often goes unpriced.

    Does this change anything for an individual borrower today?
    Not directly — nothing in the paper is a lending decision about any individual home. It signals direction: lenders are being urged by their own industry bodies to build underwriting that rewards credible improvement pathways and to put transition risk into valuations. Whether and when any specific lender adopts that is that lender’s decision.

    Sources

    • SREF / PR Newswire launch release for The Trillion-Dollar Housing Transition (28 October 2026), including quotes from Peter Panayi (SREF), Lara Knapwost (pbb Deutsche Pfandbriefbank), Sander Scheurwater and Gina Ding (RICS), Jennifer Johnson (EMF-ECBC), Shreya Sheth (PATRIZIA), Nico Dehnert (Optiml) and Jeff Rupp (INREV), and figures attributed there to UN-Habitat, UNEP and INREV.

    This article is general information about a published industry paper. It is not investment, lending or financial advice, and it is not a recommendation for or against any product, property or course of action.

  • Board Oversight & ESG-Linked Executive Compensation: Aligning C-Suite Pay with 2026 Performance Targets

    Board Oversight & ESG-Linked Executive Compensation: Aligning C-Suite Pay with 2026 Performance Targets

    A board governance blueprint for compensation committees, chief sustainability officers, and legal counsel.

    Connecting executive compensation to ESG performance has moved from a qualitative signalling exercise into a standing governance question for global enterprises: not whether sustainability belongs anywhere near the pay plan, but how a committee structures the link so it survives investor scrutiny, proxy-advisor methodology, and its own disclosure. This blueprint sets out the architecture — what the advisors actually test, what disclosure law requires, how to weight and safeguard the metrics, and the sequence a board runs for the 2026 performance cycle. It sits above the sector verticals in this series — pharmaceutical companies’ ESG executive compensation and beauty companies’ executive pay and sustainability targets — and draws its metric mechanics from the fleet’s KPI design framework for ESG performance.

    Board Governance Toolkits

    2026 ESG-Linked Pay Toolkits: Quick Card, Committee Pack & Board Pay Bot Book

    Printable allocation models, 50/100/150 gates worksheets, proxy-advisor disclosure checklists, and machine-executable AI audit routines built directly from our board governance blueprint.

    Field Reference FREE

    ESG-Linked Pay Quick Card

    2-page field summary: the STI (10–15%) and LTI (15–25%) weight bands, 50/100/150% gates grid, 4-metric reference table, and ISS/Glass Lewis disclosure test on one card.

    Download Free PDF

    Direct download • No email gate

    Working Pack $7

    2026 Committee Pack

    7-sheet printable/fillable pack: STI/LTI variable pay allocation worksheet, 50/100/150% gates grid, 4-metric data lineage log (>80% Tier-1, CSRD/IFRS S1/S2, 6.5% Scope 1+2, zero LL97 $268/ton fines), ISS/Glass Lewis checklist, CSRD GOV-3 & SB 253/261 checklist, verification worksheet, clawback contract clauses, and sector benchmark table.

    Get Committee Pack ($7) →

    Instant checkout • Square verified

    AI Intensive
    Book for Bots $17

    Board Pay Bot Book

    Feed to ChatGPT or Claude: 5 interactive AI routines (Proxy-Advisor Disclosure Stress-Test, Regulatory Disclosure Floor Mapper, STI/LTI Architect, Safeguard & Clawback Integrator, Q1-Q4 Board Roadmap Runner) + embedded command router.

    Get Bot Book ($17) →

    Software made of words • Instant delivery

    What ISS and Glass Lewis actually do — and do not — require

    The load-bearing fact first, because it is widely overstated: neither ISS nor Glass Lewis requires a company to tie variable executive pay to sustainability metrics. Their 2026 guidelines discipline two things — pay-for-performance alignment and the quality of disclosure. They test whether incentive structures are rigorous, whether performance goals are objective and measurable, whether the committee discloses weights, targets, and outcomes, and whether payouts follow the disclosed design. Where a board chooses ESG metrics, the advisors apply the same tests they apply to financial metrics: a stated weight, a quantified target, an outcome the shareholder can recompute. An ESG metric that is vague, discretionary, or paid out regardless of result draws exactly the criticism a soft financial metric would.

    The same discipline comes from the large institutional asset managers — BlackRock, Vanguard, and State Street among them — whose stewardship teams ask, in engagement and in published voting guidance, for a disclosed rationale connecting incentive design to strategy and long-term value. None of this mandates an ESG pay metric. All of it raises the cost of a badly built one. A compensation committee that adopts sustainability metrics should therefore build them to the standard the advisors will grade: transparent, quantifiable, and verified before they pay.

    The disclosure floor underneath the design

    Three regulatory regimes convert sustainability performance into standing disclosure obligations that a pay plan then samples from:

    • EU CSRD & ESRS. In-scope companies report under the European Sustainability Reporting Standards, including a double materiality assessment and governance disclosures. ESRS 2 (GOV-3) requires a company to disclose whether and how sustainability performance is taken into account in its incentive schemes — the pay link itself is reportable, whether the answer is a detailed structure or none at all.
    • California’s climate statutes (SB 253 & SB 261). Enterprise-wide Scope 1, 2, and 3 greenhouse gas reporting and climate-related financial risk disclosure, on hard regulatory submission dates, for companies doing business in California above the revenue thresholds.
    • Municipal building performance standards. Frameworks such as New York City’s Local Law 97 impose carbon intensity limits on large buildings backed by penalties of $268 per metric ton of CO2e over the limit — a recurring operating cost that lands directly in asset valuations and, through them, in executive scorecards for real-estate-exposed businesses.

    Designing the incentive structure

    A resilient architecture balances the annual plan against the long-term plan, and leading indicators against lagging ones.

    Short-term incentives (annual cash bonus) typically carry 10% to 15% of the total bonus pool for sustainability components, focused on near-term execution: data pipeline readiness, supplier onboarding, compliance milestones. Long-term incentives (performance share units) typically carry 15% to 25% of the multi-year grant, focused on cumulative decarbonization, portfolio transformation, and capital deployment over three-to-five-year cycles. Setting the overall sustainability allocation between 10% and 25% of variable pay gives the goals genuine weight without creating single-metric distortion.

    Indicator categoryFocus area & metricPractical target benchmarkIncentive vehicleVerification standard
    LeadingVendor data integration & supply-chain mappingOnboard >80% of Tier-1 suppliers into the enterprise vendor carbon reporting systemSTI (annual bonus: 5–10% weight)ISO 14064-3 data audit & vendor portal system logs
    LeadingAudit readiness & reporting frameworksComplete the CSRD double materiality matrix; align baseline disclosures with IFRS S1 and S2STI (annual bonus: 5% weight)Independent legal & external auditor attestation
    LaggingOperational GHG emissions reductionAchieve a certified 6.5% annual reduction in combined Scope 1 and 2 emissions (1.5°C SBTi alignment)LTI (3-year PSU: 10–15% weight)Third-party limited / reasonable assurance (ISAE 3000)
    LaggingReal-estate energy intensity & fine avoidanceZero statutory fine exposure across holdings under NYC Local Law 97 ($268/ton penalty)LTI (3-year PSU: 5–10% weight)Certified Energy Star & engineering energy audit reports
    Executive Pay Design Worksheets & Bot Routines

    Align 2026 Executive Pay to Disclosure Floors & Proxy Rigor

    When proxy advisors grade your 2026 proxy statement, subjective or unearned sustainability payouts draw immediate Say-on-Pay scrutiny. Our printable 7-sheet Committee Pack provides the exact allocation models (10–15% STI / 15–25% LTI), formulaic 50/100/150% gates, and model clawback clauses required by compensation committees — or feed our $17 Bot Book to ChatGPT or Claude to stress-test your metrics for ISS/Glass Lewis recomputability, map CSRD GOV-3 and California SB 253/261 disclosure floors, and draft your CD&A proxy section automatically.

    ☑

    What’s In The Toolkit:

    • Allocation Worksheet: 10–15% STI / 15–25% LTI.
    • Gates Architecture: 50% / 100% / 150% formulaic cap.
    • 4-Metric Reference: Lineage logs & verification.
    • ISS / Glass Lewis Test: Recomputable outcome audit.
    • Regulatory Floor Map: CSRD GOV-3 & SB 253/261.
    • Clawback Clauses: ISAE 3000 assurance & restatement.
    • AI Bot Book ($17): 5 prompt routines + router.
    Instant download after checkout • Printable PDF & Bot-ready text

    Committee responsibilities and anti-greenwashing safeguards

    Clear governance boundaries keep the design honest. The Compensation Committee holds primary jurisdiction over incentive plan design, weightings, threshold approvals, metric calculation formulas, clawback enforcement, and final payouts. The Sustainability & Governance Committee oversees materiality determinations, evaluates carbon accounting methodologies, recommends metrics aligned to the corporate risk register, and monitors regulatory developments.

    Three structural safeguards protect the board from enforcement and litigation exposure:

    1. Mandatory third-party verification before payout. No variable pay linked to ESG performance vests or pays out without prior independent assurance (ISAE 3000 or ISO 14064-3) from a certified external auditor.
    2. Clawback and malus provisions. Agreements carry explicit recovery triggers: vested payouts can be clawed back and unvested grants cancelled if carbon accounting data is restated, found fraudulent, or if regulatory non-compliance penalties arise from executive oversight failures.
    3. An auditable data trail. Reporting systems maintain verifiable lineage from primary operational data — utility bills, facility meters, supplier disclosures — directly to the executive scorecard metrics.

    Sector benchmarks

    Incentive metrics must reflect each sector’s operational reality. Commercial real estate: portfolio energy use intensity reductions, Energy Star certification targets, GRESB standing, and eliminating municipal penalty exposure such as Local Law 97 fines. Enterprise and technology: renewable power purchase agreement execution, Scope 3 supply-chain decarbonization, data-center power usage effectiveness, and ISSB IFRS S1/S2 disclosure readiness. Consumer brands and retail: sustainable packaging adoption, circular design metrics, and supplier carbon auditing, structured through the pay-alignment frameworks the beauty sector vertical in this series documents in detail.

    Compare 2026 ESG Executive Compensation Toolkits

    Choose the quick reference card, printable committee working pack, or machine-executable AI playbook that fits your board governance cycle:

    Free Field Summary

    ESG-Linked Pay Quick Card

    2-page field reference: condensed summary of STI/LTI weight bands, 50/100/150% gates, 4-metric benchmark table, and ISS/Glass Lewis disclosure criteria.

    FREE direct download
    • STI (10–15%) & LTI (15–25%) Allocation Bands
    • 10–25% Total Variable Pay Governance Floor
    • 50% Threshold / 100% Target / 150% Stretch Cap Grid
    • 4-Metric Reference Table (Leading vs Lagging)
    • ISS & Glass Lewis 4-Pillar Disclosure Audit Test
    • CSRD GOV-3, SB 253/261 & Local Law 97 Overview
    • Five-Step 2026 Board Governance Roadmap Timeline
    Download Free PDF
    Working Pack

    2026 Committee Pack

    Printable, fillable 7-sheet working pack with allocation models, performance gates grids, proxy checklists, and contract clawback clauses.

    $7.00 one-time
    • Sheet 1: Executive Variable Pay Allocation Worksheet
    • Sheet 2: Formulaic 50 / 100 / 150 Payout Gates Grid
    • Sheet 3: 4-Metric Benchmark Reference & Lineage Log
    • Sheet 4: ISS & Glass Lewis Disclosure Defense Checklist
    • Sheet 5: Regulatory Disclosure Floor Checklist (CSRD/SB)
    • Sheet 6: Pre-Payout Verification & Clawback Clauses
    • Sheet 7: Sector Benchmark Table & 2026 Board Checklist
    Buy Committee Pack ($7) →
    AI Intensive
    Book for Bots

    Board Pay Bot Book

    Structured 7-page AI playbook for ChatGPT, Claude, and Gemini: 5 machine-executable governance routines + embedded command router.

    $17.00 one-time
    • Routine 1: Proxy-Advisor Stress-Test (/audit-metrics)
    • Routine 2: Disclosure Floor Mapper (/map-floors)
    • Routine 3: STI/LTI Scorecard Architect (/architect-pay)
    • Routine 4: Clawback & Safeguard Integrator (/safeguard)
    • Routine 5: Q1-Q4 Board Roadmap Runner (/run-roadmap)
    • Embedded Command Router & Session Diagnostics
    • Full Governance Dossier & CD&A Proxy Text Generator
    Buy Bot Book ($17) →

    The 2026 board roadmap: five steps

    1. Materiality audit & baseline (Q1). Run the double materiality review, identify the core ESG risks, and establish audited base-year data for every target metric — data integrity before target-setting.
    2. Framework & weighting design (Q2). Set the STI/LTI allocation (10–15% short-term, 15–25% long-term), and define threshold (50% payout), target (100%), and stretch (150% cap) gates for each metric.
    3. Safeguards & clawback integration (Q3). Draft clawback, malus, and data-restatement clauses into the compensation agreements; require third-party verification (ISAE 3000) before any bonus authorization.
    4. Proxy disclosure & investor engagement (Q4). Draft the Compensation Discussion and Analysis for the annual proxy statement (DEF 14A) and engage major institutional investors and proxy advisory teams on the metric selection logic — before the vote, not after.
    5. Post-cycle verification & certification (year-end). Receive the assurance reports, have the Compensation Committee certify achievement against the disclosed design, apply any documented discretion, and authorize vesting.

    Built this way, an ESG-linked pay plan is defensible on the only ground that ultimately matters: the metrics were stated in advance, measured independently, and paid exactly as disclosed.

    Updated Nov 1, 2026 — added the free ESG-linked pay quick card, ESG-linked pay committee pack, and board pay bot book downloads to this guide.

  • CSRD Double Materiality for Real Estate: A Portfolio Implementation Guide

    CSRD Double Materiality for Real Estate: A Portfolio Implementation Guide

    Updated Nov 1, 2026 — added the free double materiality quick card, CSRD portfolio pack, and double materiality copilot downloads to this guide.

    Double materiality is where CSRD stops being a reporting exercise and becomes an underwriting input — and nowhere is that truer than in real estate. A building portfolio feels both lenses physically: impact materiality (inside-out) runs through emissions, construction waste, tenant health and the communities around each asset; financial materiality (outside-in) runs through net operating income, valuations, insurance and the cost of debt. Our CSRD compliance roadmap maps the directive’s scope and timelines after the 2026 Omnibus. This guide is the sector build that sits under it: how an asset manager actually runs the double-materiality assessment across a portfolio, maps the ESRS topical standards to property operations, solves the tenant-data problem, and arrives at disclosures that survive limited assurance.

    Instant Portfolio Implementation Downloads

    Operationalize CSRD Double Materiality Across Your Portfolio

    Field quick-reference cards, fillable calibration packs, and AI-run interrogation routines built directly from this guide to set defensible thresholds, solve tenant data gaps, and survive limited assurance.

    Field Quick Card FREE

    Double Materiality Quick Card

    2-page field card: The two lenses applied to buildings (inside-out impact vs. outside-in financial) plus the 5-point threshold calibration test and ESRS real estate map condensed onto one card.

    Download Free PDF

    Direct download • No email gate

    Working Field Pack $7

    CSRD Portfolio Pack

    Printable/fillable 7-page kit: 5-point threshold calibration sheet, ESRS topical matrix with Working metrics, physical transmission checklist, transition regulatory map, tenant 4-tier tracker, CapEx memo template, and 12-month runway planner.

    Get Portfolio Pack ($7) →

    Instant checkout • Square verified

    AI Intensive
    Book for Bots $17

    Double Materiality Copilot

    Feed to ChatGPT or Claude: 7-page executable prompt playbook running 5 AI routines (Threshold Setter, ESRS Portfolio Mapper, Tenant Data Auditor, Stranding & Valuation Underwriter, Assurance Lineage Tester) + embedded router.

    Get Copilot Book ($17) →

    Software made of words • Instant delivery

    The two lenses, applied to buildings

    Impact materiality asks what the portfolio does to people and the environment, across acquisition, development, management and tenant operations. Under ESRS 1, a negative impact is scored on severity — scale, scope and irremediable character — and, for potential impacts, likelihood, across short (1 year), medium (2–5 year) and long (up to 30 years for property) horizons.

    Financial materiality asks what sustainability developments do to the asset manager: the plausible variance in NOI, property valuations and NAV, required CapEx, insurance premiums and borrowing margins, weighted by probability over the same horizons. In real estate the two lenses share evidence — the same flood model that scores an impact scores a valuation haircut — which is why the assessment belongs in the investment process rather than beside it.

    Thresholds are yours to set and defend. ESRS prescribes the method, not a numeric cut-off. Many managers calibrate on a 5-point scale and treat topics scoring high on either lens as material; whatever boundary you choose, document it, apply it consistently, and expect the assurance provider to test topics that fell just below it.

    The ESRS map for a property portfolio

    StandardImpact focus (inside-out)Financial focus (outside-in)Working metrics
    E1 ClimateScope 1–2 emissions; Scope 3 from tenant energy and embodied carbon in constructionStranding under decarbonisation pathways (CRREM); physical-event depreciation; retrofit CapExtCO₂e/m²/yr; CRREM stranding year per asset
    E2 PollutionConstruction/maintenance runoff; VOCs and indoor air qualityRemediation liabilities; fines; tenant-retention effects of poor IAQHazardous-material area (m²); PM2.5 / VOC monitoring
    E3 WaterConsumption intensity; cooling-tower loss; stormwater dischargeUtility cost escalation; drought restrictions on coolingm³/m²/yr; % water recycled
    E4 BiodiversityGreenfield land take; habitat disruption; urban heat islandPermitting delay; offset obligations; constrained land pipeline% of portfolio in biodiversity-sensitive zones
    E5 Circular economyConstruction and fit-out waste to landfill; low component reuseMaterial price volatility; disposal costs; end-of-life value lossWaste diversion rate; % certified reusable/low-carbon materials
    S1 Own workforceProperty-management health & safety; fair payCompensation liabilities; delay costs from incidents and labour shortageLost-time injury frequency; pay-gap reporting
    S2 Value-chain workersConstruction and contracted-services labour practicesContractor litigation; supply-chain disruptionTier-1 contractor audit compliance; grievance cases
    S3 Affected communitiesDisplacement pressure; construction disruptionPlanning objections and consenting delaysConsultations held; objection counts
    S4 End-users (tenants)Indoor air quality, thermal comfort, accessibility, building safetyVacancy, default risk, renewal pricing pressureTenant satisfaction; indoor environmental quality indices
    G1 GovernanceAnti-bribery in permitting; transparent tenant billing; ethical procurementEnforcement actions; capital-raising reputationAnti-corruption training coverage; substantiated whistleblowing cases

    Where the money moves

    Physical risk transmits in a straight line: acute hazards (flood, storm, wildfire) and chronic stressors (heat, sea-level rise, water scarcity) damage the asset and interrupt operations; insurance reprices or withdraws; NOI falls while defensive CapEx rises; the capitalisation of a smaller, riskier income stream is a lower valuation. At the end of that line sit the two terminal states this site’s stranded-assets analysis works through in detail — assets whose protective CapEx exceeds their discounted cash flow, and assets the insurance market will no longer carry at any economic price.

    Transition risk is increasingly statutory. The recast Energy Performance of Buildings Directive (EU) 2024/1275 requires member states to renovate the worst-performing slice of the non-residential stock — 16% by 2030 and 26% by 2033 — with residential trajectories alongside; how leasing consequences attach is set nationally. Outside Europe the same logic arrives as direct carbon penalties: New York’s LL97 charges $268 per tonne over a building’s limit, with a good-faith mitigation path for owners who can document progress — the mechanics are in our fines calculator and DC BEPS pathways pieces. California’s SB 253/261 regime adds the disclosure layer for large operators — see the compliance playbook. A portfolio materiality assessment that ignores the regulatory map of each asset’s jurisdiction is scoring the wrong future.

    The tenant data problem

    For most portfolios, Scope 3 is the footprint — tenant energy use and embodied carbon in construction and fit-outs are commonly cited in the 70–90% range of the total — and it is the data the landlord does not meter, does not buy and often has no contractual right to see. Working portfolios climb a four-level hierarchy:

    1. Direct automated data — smart meters and automated utility feeds for whole-building consumption.
    2. Tenant aggregated data — consolidated monthly consumption shared at building level, privacy preserved.
    3. Green-lease protocols — lease clauses that make utility disclosure a standing obligation, paired with shared reduction targets and cost-recovery terms agreed before anyone is in breach.
    4. Benchmark estimation — engineering proxies (CRREM pathways, CIBSE benchmarks) filling the gaps, flagged as estimates in the lineage, and retired asset by asset as metering arrives.

    The hierarchy is also the assurance strategy: an auditor can accept a disclosed estimate with a documented method far more readily than a precise number with no provenance.

    Portfolio DMA & Scope 3 Toolkit

    Solve the Tenant Scope 3 Data Problem and Defend Limited Assurance

    Tenant energy consumption represents 70–90% of a property portfolio’s carbon footprint. Auditors do not demand immediate 100% smart-meter coverage — they demand a documented 4-level data hierarchy, defensible benchmark estimations, and auditable lineage. Whether you need printable hierarchy trackers and CapEx underwriting memo inserts, or an AI copilot to audit your lease clauses and map meter-to-XBRL provenance, equip your team with field-ready tools.

    ⚙

    What’s In The Portfolio Kit:

    • 5-Point Threshold Sheet: 1yr/2-5yr/30yr calibration.
    • ESRS Topical Matrix: E1-E5, S1-S4, G1 property metrics.
    • Transmission Chain: Hazard > Insurance > NOI > Valuation.
    • Jurisdiction Map: EPBD (16%/26%), LL97 ($268/t), BEPS.
    • Tenant Hierarchy: Automated > Aggregated > Lease > CRREM.
    • CapEx Memo Insert: Stranding year & funded plans.
    • Lineage Log & Runway: Months 1–12 XBRL roadmap.
    • Bot Copilot: 5 AI-run routines with embedded router ($17).
    Secure 1-Click Square Checkout

    Governance, lineage and assurance

    Wire the assessment into capital allocation, or it decorates a report nobody prices. The working pattern at serious platforms: every acquisition, disposition and major CapEx memo carries the asset’s double-materiality read — projected CRREM stranding year, required decarbonisation CapEx, physical-risk exposure — and assets scored high on transition risk arrive with a funded decarbonisation plan inside the underwriting, not as an appendix to it. Executive variable pay tied to verified portfolio emissions and energy-intensity outcomes (the mechanics our CRE program guide sets out) closes the loop between the assessment and behaviour.

    Assurance is a data-lineage test. CSRD reporting is subject to limited assurance, and what the assurance provider actually examines is provenance: raw meter readings and utility bills, through ingestion and validation, emission-factor application and pathway modelling, to the tagged disclosure — with version control, unit conversions and deviation sign-offs visible at each step. Reports are published in machine-readable form with Inline XBRL tagging of material metrics. Build the lineage as you collect, and the assurance engagement is a review; build it afterwards, and it is an excavation.

    A realistic 12-month runway: months 1–3, run the double-materiality assessment and secure investment-committee sign-off on thresholds; months 4–6, build the data architecture — automated ingestion, green-lease rollout, estimation models for the gaps; months 7–9, test controls with a mock assurance engagement and fix what it finds; months 10–12, produce the tagged report and take it through external limited assurance.

    Portfolio Product Comparison

    Compare Double Materiality Implementation Tiers

    Choose the operational tier that matches your portfolio’s reporting timeline and assurance readiness: quick reference card, printable working worksheets for asset managers, or an AI copilot to interrogate underwritings and trace data lineage.

    Field Summary

    Double Materiality Quick Card

    2-page field card condensing the two lenses, the 5-point threshold scale, and the real estate ESRS map onto one reference card.

    • Two-lens definition (Inside-Out Impact vs. Outside-In Financial)
    • 5-point threshold scale (severity, scope, irremediable, likelihood)
    • Real estate time horizons (1-yr, 2–5 yr, up to 30-yr property)
    • ESRS E1–E5, S1–S4, G1 core building metrics summary
    • Tenant Scope 3 4-level data hierarchy quick glance
    • Limited assurance test criteria for just-below topics
    FREE
    Download Quick Card (PDF)

    Instant direct download • No email gate

    Static Working Pack

    CSRD Portfolio Pack

    7-page printable & fillable operational toolkit for asset managers, investment committees, and ESG controllers.

    • 5-point threshold calibration sheet (scale, scope, irremediable)
    • ESRS E1–E5, S1–S4, G1 matrix with Working metrics
    • Physical transmission checklist (hazard > insurance > NOI > haircut)
    • Transition jurisdiction worksheet (EPBD, LL97, BEPS, SB 253/261)
    • Tenant-data 4-level hierarchy tracker & estimation flags
    • CapEx memo insert & funded decarbonisation plan template
    • Limited-assurance lineage log & 12-month runway planner
    • Signoff block for investment committee approval
    $7.00
    Get Portfolio Pack ($7) →

    Instant checkout • Square verified • Instant delivery

    AI Intensive
    Book for Bots

    Double Materiality Copilot

    7-page executable AI workbook: feed directly into ChatGPT or Claude to run interactive portfolio double materiality audits and disclosures.

    • Threshold Setter Interview (/threshold-setter): 5-point calibration
    • ESRS Portfolio Mapper (/esrs-mapper): E1–G1 topical mapping & flags
    • Tenant Hierarchy Auditor (/tenant-hierarchy): Leases, clauses & proxy retirement
    • Stranding & Valuation Underwriter (/stranding-underwriter): CRREM & terminal states
    • Assurance Lineage Tester (/assurance-tester): Meter-to-XBRL provenance check
    • Embedded Output Router: “Software made of words” runtime engine
    $17.00
    Get AI Copilot Book ($17) →

    Instant checkout • Square verified • Instant delivery

    Frequently asked questions

    After the Omnibus, is a mid-size asset manager even in CSRD scope?

    Possibly not directly — Omnibus I narrowed direct scope substantially, and our roadmap piece tracks the current thresholds and waves. But double materiality reaches most serious managers anyway: through in-scope funds and parent groups, through lender and investor diligence, and through the EPBD and national building regimes that apply asset by asset regardless of the manager’s reporting status. The methodology is the durable asset; scope is a moving boundary.

    Is CRREM mandatory under ESRS?

    No. ESRS E1 requires a transition plan and emissions disclosure; it does not name a pathway tool. CRREM is the sector’s standard decarbonisation-pathway framework — the stranding-year analysis assurance providers and lenders most readily recognise — which makes it the pragmatic default rather than a legal requirement.

    Do tenant emissions really belong in the landlord’s report?

    Yes, where material: energy used by tenants in leased space sits in the landlord’s Scope 3 (downstream leased assets), and for most portfolios it is the largest single block. Estimation is permitted — what is not defensible is omitting the category because metering is incomplete. Disclose the hierarchy level each asset’s data comes from.

    Limited or reasonable assurance — which should we prepare for?

    Limited assurance is the operative standard, and as amended by Omnibus I the regime stays there — the earlier planned escalation to reasonable assurance was removed. Prepare for limited assurance done properly: tested controls, traceable lineage, documented judgements. That preparation also happens to be most of what reasonable assurance would have demanded.


    Sources: ESRS 1 (General Requirements) double-materiality method; Directive (EU) 2024/1275 (EPBD recast) — non-residential minimum performance trajectories (16% of worst-performing stock by 2030, 26% by 2033); CRREM decarbonisation pathways for real estate; NYC Local Law 97 / 1 RCNY 103-14 ($268/tCO₂e); CSRD as amended by Omnibus I (Directive (EU) 2026/470) — limited assurance retained, reasonable-assurance escalation removed. Companion pieces: BC ESG’s CSRD compliance roadmap, CRE ESG program guide, DC BEPS pathways, LL97 fines calculator and California SB 253/261 playbook.

BC ESG

ESG Strategy, Sustainability Intelligence, and Business Continuity for Forward-Thinking Organizations

© 2026 BC ESG — Business Continuity, ESG & Sustainability Intelligence