
All figures carry explicit source and as-of date: ESA 2026 Space Environment Report (data through end of 2025) and NASA ODPO ODQN (2025–2026).
ORBITAL SUSTAINABILITY · MEASUREMENT & ESG GAP · ESA 2026 REPORT & NASA ODPO ODQN
ESA & NASA Debris Counts (2026)
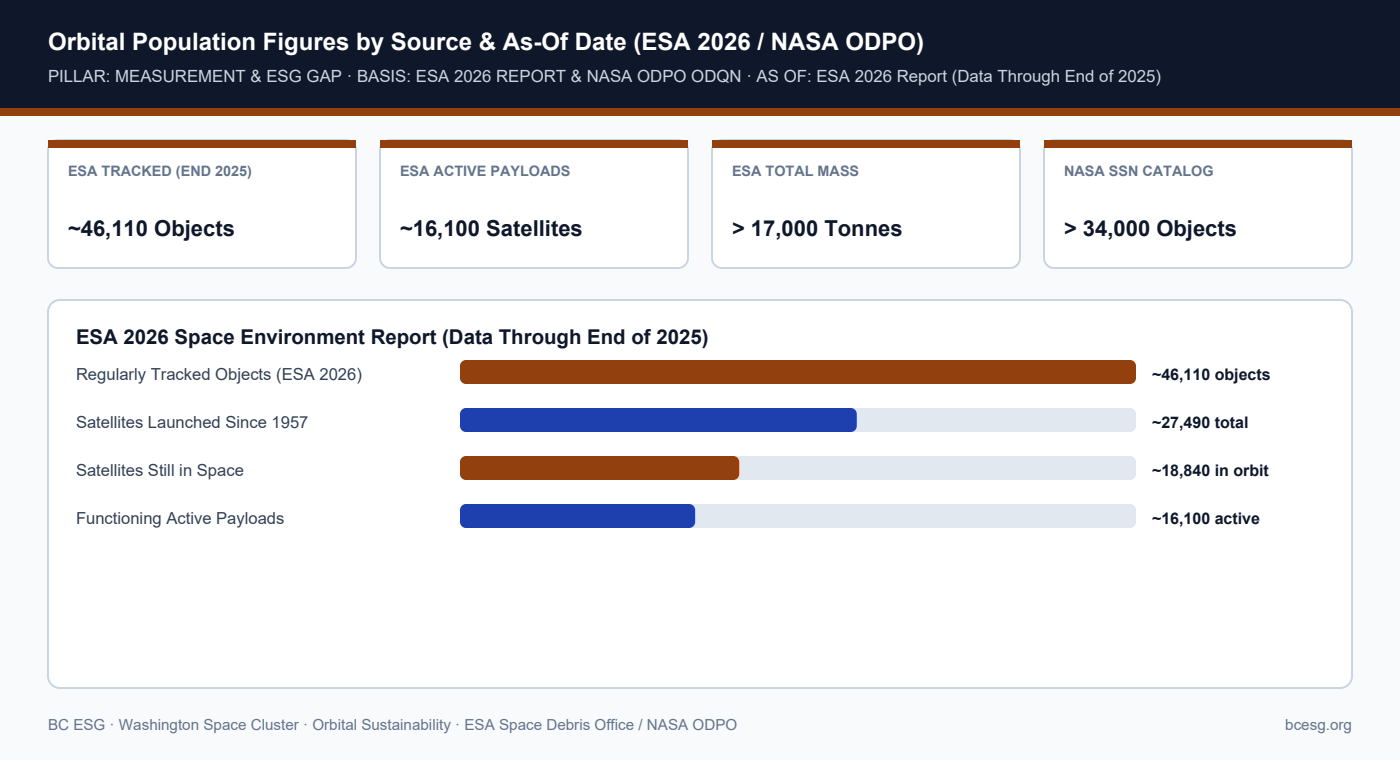
ESA's 2026 Space Environment Report (data through end of 2025) records ~46,110 regularly tracked objects, ~16,100 active payloads, and >17,000 tonnes in orbit—while NASA ODPO's U.S. Space Surveillance Network catalog exceeds 34,000 objects; differing thresholds explain why every figure must carry its source and as-of date.
Primary Authority / Source: ESA Space Debris Office / NASA ODPO | As-Of / Horizon: ESA 2026 Report (Data Through End of 2025)
Documented Instrument & Engineering Record
- Mandatory source-and-date rule: Orbital population numbers move daily (~10 objects launched/day and >3 intact objects/rocket bodies reentering/day in 2025 per ESA 2026); undated claims are unverifiable.
- ESA 2026 Space Environment Report (Issue 10, data through end of 2025): ~46,110 regularly tracked objects (up from ~40,000 in 2025), ~27,490 satellites placed in orbit since 1957, ~18,840 still in space, ~16,100 active payloads, >17,000 tonnes total mass, and >660 historical breakups.
- NASA ODPO / ODQN (2025–2026): Reports >34,000 officially cataloged objects in the U.S. Space Surveillance Network (SSN) and 50,000+ broader trackable objects.
- Why counts differ: SSN catalog numbers reflect publicly maintained TLE/catalog IDs with confirmed origins, whereas ESA's ~46,110 includes broader tracked object sets and MASTER-8 statistical models.
Authoritative Orbital Population Figures (Dated & Sourced)
| Metric | Published Figure | Source & As-Of Date |
|---|---|---|
| Regularly Tracked Objects | ~46,110 (up from ~40,000) | ESA 2026 Space Environment Report (end 2025) |
| Functioning / Active Payloads | ~16,100 (~18,840 still in space) | ESA 2026 Space Environment Report (end 2025) |
| Total Orbital Mass | > 17,000 tonnes | ESA 2026 Space Environment Report (end 2025) |
| U.S. SSN Official Catalog | > 34,000 objects | NASA ODPO / ODQN (2025–2026) |
Mission Designer, Compliance Lead & Founder Takeaways
- Never mix SSN catalog counts (>34,000) with ESA tracked (~46,110) or ESA MASTER-8 >10 cm modeled counts (~68,450) in the same numerator without labeling definitions.
- Every compliance dossier or investor brief citing orbital congestion should cite ESA DISCOS / Space Environment Report or NASA ODQN with its exact publication issue.
- High launch rates (~10 objects/day in 2025) make static annual snapshots obsolete within quarters.
Connected Census Profiles, Segments & Rules
- Untrackable 1 mm–10 cm Debris Risk
- Conjunction Assessment & Collision Avoidance
- WA Space Cluster Hub