Blog

  • The SEC Climate Rule May Die. Local Law 97 Will Not.

    The SEC Climate Rule May Die. Local Law 97 Will Not.

    The SEC comment window on killing the 2024 climate disclosure rule closed. That is a federal filing story. It is not a hall pass for a New York building. If you manage square footage over 25,000 in this city, Local Law 97 did not notice Chairman Atkins. The cap, the $268-per-ton penalty, and the DOB calendar are still the job.

    What actually ended

    On May 29, 2026 the Commission proposed to rescind the March 2024 climate disclosure rules in full (Release 2026-49). The rules have been stayed since April 2024. In March 2025 the Commission stopped defending them. Comments ran 60 days after the June 3 Federal Register notice — through early August. The proposal is not a final repeal yet. It is also not a stay of any city or state building law. For the insurance and NAIC-side implications of this same rescission, see The SEC Climate Rule May Die. The NAIC Survey Is Still Due August 31 on Risk Coverage Hub. We already walked the federal timeline here: SEC climate disclosure rule — requirements, timeline, compliance. Do not reread that as “ESG is over.”

    What did not end

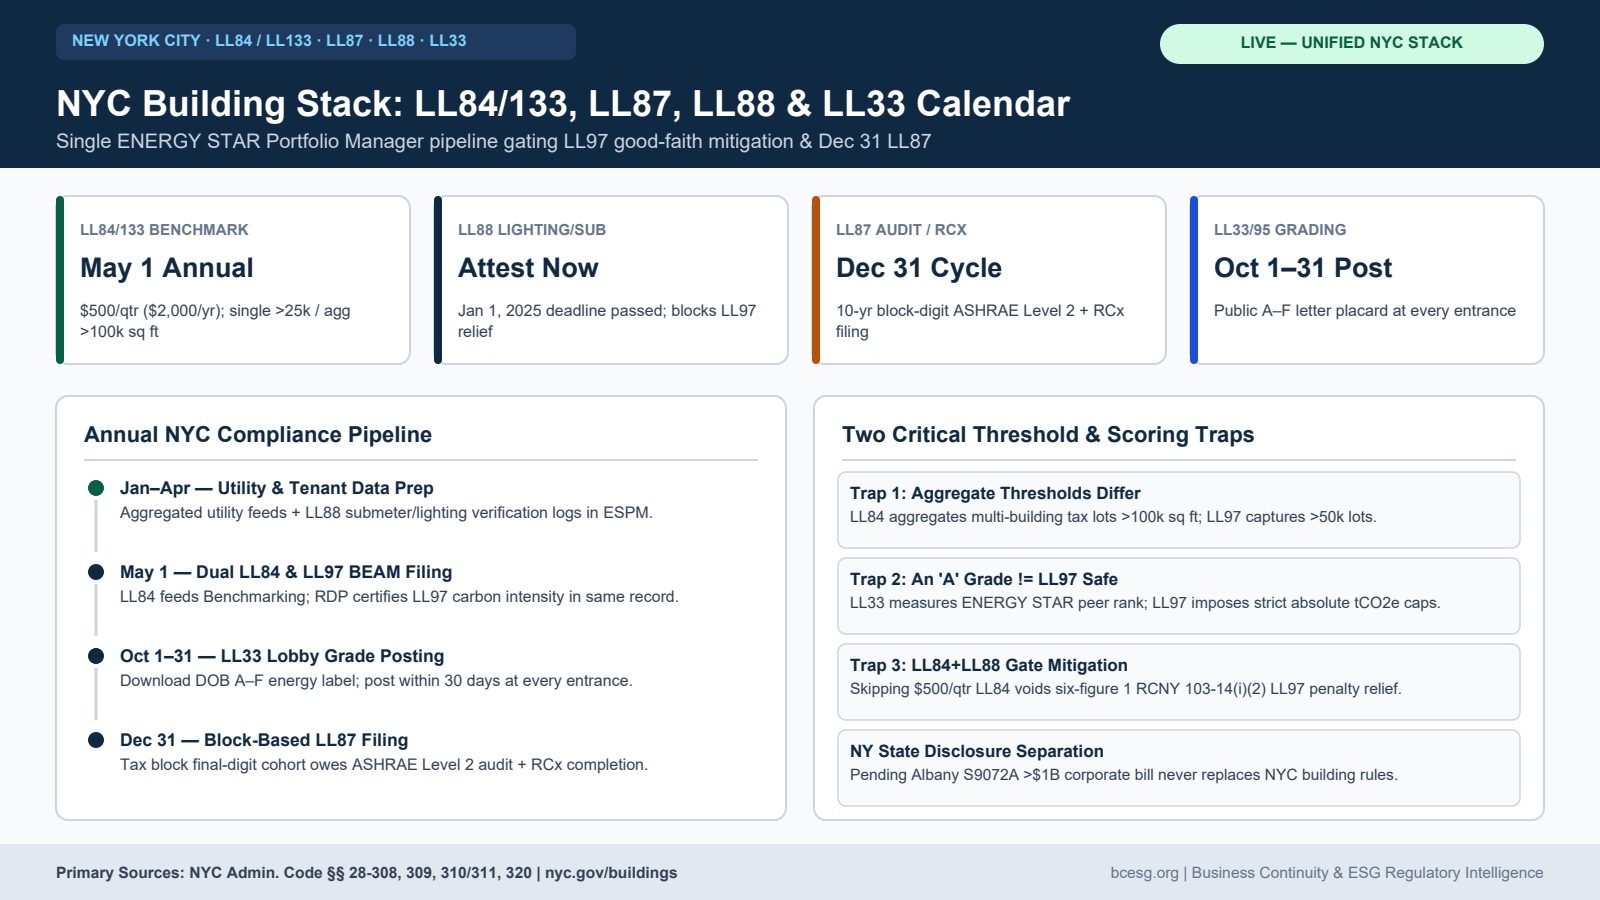
    NYC Accelerator still has it in one sentence: most buildings over 25,000 gross square feet sit under an annual carbon cap, with a $268 per metric ton CO2e penalty for going over. First compliance period is 2024–2029. Limits tighten in 2030. Reports go to DOB, certified by a PE or RA, through BEAM. The annual report is due May 1, reflecting last year’s energy. DOB allows a grace period through June 30. For 2026 filings only, owners who applied for the $60 BEAM extension by June 30, 2026 got until August 29, 2026. If you did not apply, that extra month is not sitting there waiting. See the NYC Accelerator LL97 page and DOB’s LL97 site. The stack (LL84 / LL88 / LL97 / LL33) is still one calendar: NYC building compliance stack.

    What to do this month

    1. If you have the August 29 extension, file. Do not spend the week rewriting a 10-K climate section that the SEC is trying to delete.
    2. If you missed June 30, treat it as late and call the RDP. Late filing and over-cap are different penalties. Mixing them up is how boards get surprised.
    3. Keep the 2030 model. Accelerator’s public estimate: most buildings clear the first period; more than half are on track to miss 2030–2034. That is the real money.
    4. Article 321 buildings (certain affordable and houses of worship) are a different path. Do not copy a market-rate 320 playbook onto them.
    Federal disclosure is a form. LL97 is a boiler and a bill. Run the one that fines the BIN. Sources: SEC Release 2026-49 (May 29, 2026); Federal Register June 3, 2026; NYC Accelerator — Local Law 97; NYC DOB LL97.

    Related reading: Article 320 vs 321, LL84 as the LL97 prerequisite, and August 25 regulatory watch. Sister hubs: Restoration Intel, Healthcare Facility Hub, Continuity Hub, Risk Coverage Hub, and Tygart Media.

  • Commercial Real Estate Disaster Recovery & Facility Continuity Plan: The 2026 Operational Framework

    Commercial Real Estate Disaster Recovery & Facility Continuity Plan: The 2026 Operational Framework

    Updated October 26, 2026. By Will Tygart.

    Updated Oct 31, 2026 — added the free plant room pre-storm quick card, facility continuity print pack, and AI operator downloads to this framework.

    This is the facility continuity framework for a commercial building. Life safety, freeze protection, water, elevators, and tenant HVAC come before the server runbook. The information-technology tiers farther down this page still matter, because access control, the building management system, and the tenant portal die when the plant room dies. The slug of this page is unchanged.

    Portfolio operators who want the life-safety, vendor, and claims stack in shorter form should also use Disaster Recovery for Commercial Real Estate Portfolios. This page keeps both the building-systems plan and the technology plan.

    Instant Engineering & Operations Downloads

    Facility Continuity: Plant Room Quick Card, Print Pack & AI Operator

    Grounded operational checklists, Scope 1 fuel logs, and machine-executable bot routines built directly from this 2026 Facility Continuity framework.

    Quick Reference
    FREE

    Plant Room Pre-Storm Quick Card

    2-page field card: the article’s 9-point pre-storm plant room and basement checklist condensed to one card, with building-systems recovery targets (<1hr life safety to 24–48hr HVAC) and Article 320 compliance rules beside it.

    Download Free PDF

    Direct download • No email gate

    Working Pack
    $7

    2026 Facility Continuity Print Pack

    5-page working pack: 1-page systems recovery targets, 9-point plant checklist with sign-offs, Scope 1 generator fuel log sheet for Article 320 penalty filing ($268/ton), drying kW worksheet, and Technology Tier 1–4 matrix.

    Get Print Pack ($7) →

    Instant checkout • Square verified

    AI Intensive
    Book for Bots
    $17

    Facility Continuity AI Operator

    Feed to ChatGPT or Claude: 5 autonomous routines (/plant-room-readiness, /systems-target-audit, /outage-filing-builder, /bia-tier-assigner, /ransomware-declaration) with dirty failover block and embedded router.

    Get AI Operator ($17) →

    Software made of words • Instant delivery

    Building-systems recovery targets

    These are planning targets for a facility continuity plan. They are not adopted code, and they are not a substitute for the fire-alarm sequence or the elevator recall the authority having jurisdiction already required.

    Building system Planning target What “back” means
    Life safety and fire command Under 1 hour Emergency egress lighting, fire pump, auxiliary generator start, and smoke-control dampers.
    Thermal envelope and freeze protection Under 4 hours Minimum circulation heat, pipe-freeze prevention, and secondary power to the critical risers.
    Domestic water and sewage ejectors Under 8 hours Backflow preventer checked, sump and ejector pumps on emergency power.
    Vertical transportation Under 12 hours Emergency return of elevators, and a freight car prioritized for restoration crews.
    Tenant HVAC and comfort Under 24 to 48 hours Chiller or boiler restart in sequence, and dehumidification before microbial growth.

    Post-disaster carbon risk

    A freeze or a flooded plant room does not only stop the building. Temporary diesel generation, boiler bypass, and drying equipment add fuel and electricity the building was not counting on. In New York City, on-site fuel combustion is Scope 1. Under Article 320, the penalty for exceeding the annual limit is the excess metric tons of carbon dioxide equivalent multiplied by $268, per 1 RCNY 103-14(h). The same rule, at subdivision (i), treats an unexpected or unforeseeable event, including disaster damage, as a mitigating factor that has to be documented with the emissions report. Mitigation is a filing, not a hope.

    Three operating rules follow from that, without pretending a dryer has a universal efficiency rating:

    • Log generator fuel as soon as the unit starts. Hours, gallons, and which meter or tank it came from. That log is the Scope 1 number.
    • Specify high-efficiency refrigerant dehumidifiers and desiccant drying in the restoration scope so the kilowatt load is a managed input, and keep the power readings.
    • Sign the restoration contract before the storm. The master service agreement should require the contractor to track fuel and kilowatt-hours. The commercial protocol for that handoff is the Restoration Carbon Protocol portal, and the New York property-manager application is the CRCP New York guide.

    Physical and financial climate risk, as a disclosure question rather than a plant-room question, is the Physical and Financial Climate Risk Disclosure Framework. How an insurer reads a Local Law 97 miss during an outage is LL97 business continuity and insurance. Water-damage practice for the restoration crew is Restoration Intel. The business-continuity management layer is Continuity Hub.

    Pre-storm plant room and basement checklist

    This is an operator checklist for a commercial plant room and a basement that can flood. It is not a code inspection.

    • Fire pump on emergency power, controller lamps noted, fuel or battery condition written down.
    • Generator starts under load, runtime and fuel reserve recorded, spill kit at the tank.
    • Sump and sewage ejector pumps tested, check valves seated, emergency circuits identified.
    • Backflow preventer accessible, domestic-water shutoff labeled, flood line marked in the room.
    • Minimum heat and riser circulation confirmed, with a named person who can restart it.
    • Elevator recall and the freight car for crews confirmed with the vendor’s after-hours number.
    • Tenant re-entry rule written: who may open the building, and who may not.
    • Photos of mechanical rooms taken before the weather arrives, so the loss is comparable.
    • Restoration contractor named in a signed agreement that requires fuel and kilowatt tracking.

    Disclaimer: This framework is prepared for commercial facility directors, property managers, and asset managers for operational planning. It does not replace a site-specific emergency action plan, a mechanical design, or a stamped filing by a licensed Professional Engineer (PE) or Registered Architect (RA). The recovery targets in the building-systems table are planning targets for this guide, not adopted code.

    Plant Room & Emissions Governance

    Lock Down Your Plant Room & Scope 1 Emissions Before Landfall

    During major weather events, temporary diesel generation, boiler bypass, and drying equipment add unplanned fuel and electricity. Under NYC Article 320, excess carbon costs $268 per metric ton unless documented as an unforeseen disaster event under 1 RCNY 103-14(i). Use our fillable print pack to log generator fuel from minute one and deploy the AI Operator to audit vendor SLAs, RTO targets, and ransomware defenses.

    ⚙

    What’s In The Toolkit:

    • 9-Point Plant Checklist: Sign-offs & vendor SLAs.
    • Recovery Targets Ref: <1h to 24–48h definitions of back.
    • Article 320 Fuel Log: Hours, gal, $268/ton defense.
    • Restoration Drying Scope: LGR & desiccant kW loads.
    • IT Tiers 1–4 Worksheet: RTO/RPO + failover mapping.
    • AI Operator Playbook: 5 routines + router ($17).
    Secure 1-Click Square Checkout

    Technology RTO and RPO tiers

    Use the building-systems table above for the plant. Use this table for the information systems that sit on that plant. Continuity Hub holds the ISO-oriented business-impact tools. Restoration after the water is out is Restoration Intel.

    Tier Examples RTO RPO Strategy
    1 – Mission critical Access control, fire/life safety, emergency comms, payment/lease systems Under 1 hour Near-zero Hot site / sync replication
    2 – Business critical Work-order, tenant portal, email, identity provider 4-8 hours 1-4 hours Warm site / async
    3 – Support HR, reporting, development 24-72 hours 24 hours Cold site / backups
    4 – Non-critical Archives, test 1 week+ Weekly Offsite restore

    FAQ

    What org structure does IT disaster recovery need?

    Name a recovery owner and an alternate for every Tier 1 system. Separate incident commander (business) from technical lead (IT). Pre-authorize vendor after-hours contacts. If the identity provider is in the cloud, the on-prem building stack is in the same blast radius – put identity on the same tier as access control.

    What belongs in a disaster recovery plan for business data?

    RPO by system, backup immutability, restore-test evidence, and who can declare a ransomware event. Backups are not the plan. The plan is detection, declaration, restore order, integrity check, then return to production.

    Is disaster recovery the same as business continuity?

    No. DR restores systems. BC keeps the business operating (people, tenants, vendors, communications). See the hotel BCP and property-management BCP.

    What about ransomware and auto-failover in 2026?

    Treat ransomware as a declared disaster with a separate runbook: isolate, preserve forensics, restore from immutable backups, do not fail over a dirty replica. Auto-failover is for infrastructure loss, not for encryption events.

    Who should own this on a CRE board?

    Operational resilience is a governance metric. Point the board to CRE ESG programs and the climate physical-risk guide so DR is not parked as an IT policy.


    Every organization operates under the assumption that its systems will be available tomorrow. A disaster recovery plan exists to protect the organization when that assumption fails. Whether the trigger is a ransomware attack encrypting production databases, a hurricane flooding a data center, or a cascading cloud outage pulling dependent services offline, the distance between an organization that recovers in hours and one that never fully recovers is a documented, tested, and funded disaster recovery framework.

    In 2026, the stakes have escalated. Hybrid IT architectures have multiplied the interdependencies between cloud and on-premises systems. Regulatory bodies across finance, healthcare, and real estate have moved from recommending disaster recovery to mandating it with audit trails. ESG frameworks now treat operational resilience as a governance metric, making business disaster recovery a boardroom concern rather than an IT department afterthought.

    This guide provides the complete framework: from the foundational analysis that determines what to protect, through the technical architectures that enable recovery, to the testing and governance protocols that ensure the plan actually works when invoked.

    What a Disaster Recovery Plan Actually Covers

    Definition: A disaster recovery plan (DRP) is a documented, structured set of procedures for restoring IT systems, applications, and data to an operational state after a disruptive event. It specifies recovery priorities, technical procedures, team responsibilities, and communication protocols, all calibrated to predefined recovery objectives.

    A disaster recovery plan is not a backup strategy. Backups are one component. The plan encompasses the full recovery lifecycle: detection and declaration of a disaster, activation of recovery procedures, restoration of systems in priority order, validation of data integrity, and return to normal operations. It assigns ownership at every stage and defines the decision authority for escalation.

    The scope of a modern IT disaster recovery plan includes:

    • Infrastructure recovery: Servers, networks, storage, and virtualization platforms
    • Application recovery: Business-critical applications restored in dependency order
    • Data recovery: Database restoration, transaction log replay, and data validation
    • Communication recovery: Voice, email, collaboration tools, and emergency notification systems
    • Facility recovery: Alternate work locations, building management systems, and physical access controls
    • Third-party recovery: Vendor dependencies, SaaS platforms, and cloud service continuity

    The DRP operates as a subset of the broader business continuity plan, which covers non-technical recovery functions including personnel, supply chain, and customer communications.

    Business Impact Analysis: The Foundation You Cannot Skip

    Definition: A Business Impact Analysis (BIA) is a systematic process that identifies and evaluates the potential effects of an interruption to critical business operations. It quantifies financial loss, regulatory exposure, reputational damage, and operational degradation across time horizons to establish recovery priorities.

    Every disaster recovery plan begins with a Business Impact Analysis. Without a BIA, recovery priorities are based on assumptions and politics rather than measured business impact. The BIA produces three outputs that directly shape the DRP:

    Critical Process Identification

    The BIA maps every business process to its supporting technology systems and quantifies the cost of downtime per hour, per day, and per week. This is not a theoretical exercise. It requires input from business unit leaders who can articulate actual revenue impact, contractual penalties, regulatory fines, and customer attrition rates tied to specific system outages.

    Recovery Time Objective (RTO) and Recovery Point Objective (RPO)

    Definition: Recovery Time Objective (RTO) is the maximum acceptable duration between a disruption and the restoration of a system to operational status. Recovery Point Objective (RPO) is the maximum acceptable amount of data loss measured in time – the point to which data must be recovered after a disruption.

    RTO and RPO are the two metrics that govern every technical decision in the disaster recovery framework. They are not interchangeable, and they must be set independently for each system tier:

    System Tier Examples RTO Target RPO Target Recovery Strategy
    Tier 1 – Mission Critical Financial transactions, emergency systems, building access control < 1 hour Near-zero Hot site / synchronous replication
    Tier 2 – Business Critical ERP, email, CRM, tenant management platforms 4-8 hours 1-4 hours Warm site / asynchronous replication
    Tier 3 – Business Support HR systems, internal portals, development environments 24-72 hours 24 hours Cold site / scheduled backups
    Tier 4 – Non-Critical Archived data, legacy systems, test environments 1 week+ Weekly Offsite backup restoration

    The fatal mistake is setting uniform RTOs across all systems. A Tier 1 recovery architecture costs ten to fifty times more than Tier 3. Applying Tier 1 standards to Tier 3 systems wastes budget. Applying Tier 3 standards to Tier 1 systems creates existential risk. The BIA prevents both errors. For a broader view of how risk assessment feeds into these tiering decisions, see the complete risk assessment guide.

    Recovery Site Strategies: Hot, Warm, Cold, Cloud, and DRaaS

    The disaster recovery framework must specify where systems will be recovered. In 2026, organizations typically deploy a combination of strategies matched to system tiers.

    Hot Site

    A hot site is a fully operational duplicate of the production environment, running live with real-time data replication. Failover is near-instantaneous – often automated. Hot sites deliver RTOs measured in minutes and RPOs approaching zero. The cost is substantial: you are paying for a fully provisioned environment that sits idle during normal operations. Hot sites are justified only for Tier 1 systems where the cost of downtime exceeds the cost of the standby infrastructure.

    Warm Site

    A warm site has the hardware and network infrastructure pre-provisioned but does not run production workloads in real time. Data is replicated asynchronously, introducing a gap between the last replicated transaction and the point of failure. Activation requires loading current data and starting services – typically achievable in 4 to 12 hours. Warm sites balance cost against recovery speed for Tier 2 systems. For guidance on selecting between these options, disaster recovery site selection covers geographic, regulatory, and infrastructure considerations.

    Cold Site

    A cold site provides physical space, power, and network connectivity but no pre-installed equipment. Recovery requires shipping, installing, and configuring hardware before data restoration can begin. RTOs are measured in days to weeks. Cold sites are appropriate for Tier 3 and Tier 4 systems or as a last-resort fallback if primary and secondary recovery sites are both compromised.

    Cloud Disaster Recovery and DRaaS

    Definition: Disaster Recovery as a Service (DRaaS) is a cloud-based managed service that replicates and hosts an organization’s physical or virtual servers, providing failover to a cloud environment in the event of a disaster. The provider manages the recovery infrastructure, replication, and often the failover orchestration.

    Cloud DR has become the default recovery strategy for organizations without the capital or operational capacity to maintain dedicated recovery sites. Cloud DR and DRaaS platforms offer compelling advantages: elastic scaling (pay for full compute only during a declared disaster), geographic redundancy across multiple regions, and API-driven automation that enables recovery orchestration.

    The risk in 2026 is concentration. When the primary production environment runs in AWS, Azure, or Google Cloud and the disaster recovery environment runs in the same provider – or even the same region – a provider-level outage eliminates both. The 2024 and 2025 cascading cloud outages demonstrated that multi-region does not always mean multi-fate. Organizations with aggressive RTOs should consider multi-cloud DR or a hybrid model with on-premises fallback for Tier 1 systems.

    Hybrid IT Considerations: The Cascading Dependency Problem

    Most enterprise IT environments in 2026 are hybrid: a mix of on-premises infrastructure, private cloud, public cloud IaaS/PaaS, and SaaS applications. The IT disaster recovery plan must account for the interdependencies between these layers.

    A cloud outage does not stay in the cloud. When the identity provider runs in Azure and the on-premises applications authenticate through it, an Azure outage takes down on-premises applications that are otherwise fully functional. When the SD-WAN controller runs in AWS and branch office routing depends on it, an AWS outage fragments the corporate network. These cascading failures are the defining challenge of hybrid DR planning.

    The mitigation approach requires:

    • Dependency mapping: Documenting every cross-environment dependency – not just direct integrations but transitive dependencies (System A depends on System B, which depends on Cloud Service C)
    • Isolation boundaries: Designing systems so that a failure in one environment does not propagate. This means local caching of authentication tokens, DNS failover independent of cloud providers, and fallback routing that does not depend on cloud-hosted controllers
    • SLA stacking analysis: Understanding that when you chain five services each with 99.9% uptime, the composite availability is 99.5% – and the DR plan must cover the gap
    • Multi-vendor resilience: Avoiding single-provider dependency for services that underpin the entire technology stack

    This complexity is why the operational resilience discipline has emerged alongside traditional disaster recovery – it focuses on end-to-end service delivery rather than individual system recovery.

    Compliance Frameworks: ISO 22301, NIST SP 800-34, and DORA

    Disaster recovery planning in 2026 operates within an increasingly prescriptive regulatory environment. Three frameworks dominate.

    ISO 22301: Business Continuity Management Systems

    ISO 22301 is the international standard for business continuity management, including disaster recovery. It requires organizations to establish a BCMS (Business Continuity Management System) with documented policies, BIA, risk assessment, recovery strategies, incident response procedures, and a testing program. Certification requires external audit. For organizations in commercial real estate and financial services, ISO 22301 certification is increasingly a contractual requirement from tenants, investors, and insurers. The broader ESG regulatory landscape is accelerating this trend.

    NIST SP 800-34: Contingency Planning Guide

    NIST Special Publication 800-34 provides the U.S. federal government’s framework for IT contingency planning, which extends to any organization doing business with federal agencies. It defines seven steps: develop the contingency planning policy, conduct the BIA, identify preventive controls, create contingency strategies, develop the contingency plan, test and exercise the plan, and maintain the plan. NIST 800-34 is particularly relevant for organizations managing critical infrastructure or government-contracted facilities.

    DORA: Digital Operational Resilience Act

    The EU’s Digital Operational Resilience Act, fully enforceable since January 2025, applies to financial entities and their critical ICT third-party providers. DORA mandates specific disaster recovery requirements including documented recovery plans, regular testing with results reported to regulators, and explicit third-party risk management for cloud and technology providers. U.S. organizations with EU financial sector clients or operations must comply. DORA’s testing requirements go beyond previous standards – it requires threat-led penetration testing and advanced scenario testing that simulates sophisticated attack chains.

    Aligning the DRP to these frameworks simultaneously is achievable because they share common structural elements. The practical approach is to build the DRP to the most stringent requirement across all applicable frameworks, then map compliance evidence to each standard’s specific documentation requirements. Understanding governance and ESG integration helps contextualize why these compliance frameworks are converging.

    The Disaster Recovery Plan Document: Structure and Content

    A disaster recovery plan that exists only as a high-level policy document will fail in execution. The plan must be operationally specific. The following sections represent the minimum content for an actionable DRP.

    Plan Activation and Disaster Declaration

    Define the criteria for declaring a disaster and activating the plan. Specify who has authority to declare (primary and alternates), the communication chain for notification, and the thresholds that distinguish a disaster from a routine incident. A common failure: the plan exists but nobody knows when to invoke it, so a slow-developing disaster goes unrecognized until recovery options have narrowed.

    Runbooks and Recovery Workflows

    Each system tier requires a detailed runbook: step-by-step technical procedures for recovery, written for the competence level of the person who will execute them under stress. Runbooks must include:

    • Pre-conditions and dependencies (what must be recovered first)
    • Credentials and access procedures (stored securely, accessible during outage)
    • Validation steps (how to confirm the system is recovered correctly)
    • Rollback procedures (what to do if recovery introduces errors)
    • Estimated time for each step

    Recovery workflows sequence the runbooks across systems according to dependency order and priority tier. A building management platform cannot be recovered before the network and authentication systems it depends on.

    Team Assignments and Escalation Procedures

    Every recovery task must have a named owner with a documented alternate. The plan must include a communication tree that works when primary communication channels are down – because the disaster may have taken those channels down too. Out-of-band communication methods (personal cell phones, satellite phones for critical scenarios, pre-configured messaging apps) must be specified and current. Escalation criteria define when a team lead elevates to management, when management elevates to executive leadership, and when external resources (vendors, regulators, law enforcement) are engaged.

    Communication Procedures

    Internal communication to staff, external communication to customers and partners, regulatory notification requirements, media handling protocols, and status update cadences must all be pre-scripted. During a disaster, drafting communications from scratch wastes time and introduces messaging errors. Templates should be prepared, reviewed by legal, and stored in the DRP alongside the technical runbooks.

    Testing the Disaster Recovery Plan

    An untested disaster recovery plan is a hypothesis. Regular DR testing transforms it into demonstrated capability. Three testing levels serve different purposes.

    Tabletop Exercises

    Tabletop exercises gather the recovery team around a scenario and walk through the plan verbally. No systems are actually failed over. The value is in identifying gaps in the plan document, unclear responsibilities, and outdated procedures. Tabletop exercises are low-cost and low-risk – they should be conducted quarterly.

    Technical Failover Tests

    Failover tests execute actual recovery procedures for specific systems in a controlled environment. Data replication is validated, recovery scripts are run, and RTOs are measured against targets. These tests reveal whether the technical procedures work and whether the stated RTOs are achievable. Semi-annual technical tests are the minimum for Tier 1 and Tier 2 systems.

    Full-Scale Simulations

    A full-scale simulation declares a disaster and activates the entire plan – including personnel mobilization, communication procedures, and parallel recovery of all systems. This is the only test that validates the plan end-to-end, including the human coordination elements that tabletop exercises cannot fully simulate. Annual full-scale simulations are the standard for organizations subject to regulatory audit.

    Every test must produce a documented after-action report. The report identifies what worked, what failed, what took longer than planned, and what has changed since the last test. Plan updates driven by test findings must be completed within 30 days of the exercise.

    Disaster Recovery for Commercial Real Estate

    Commercial real estate properties present unique DR challenges that generic IT frameworks do not fully address. Building operations depend on specialized systems – HVAC controls, elevator management, fire and life safety systems, access control, and energy management platforms – that have their own recovery requirements and interdependencies.

    Building Management Systems (BMS)

    Modern BMS platforms are IP-networked and increasingly cloud-connected. A network outage or cyber attack can disable environmental controls across an entire portfolio. The DRP must address BMS failover to local control modes, manual override procedures for critical safety systems, and the priority sequence for restoring automated building controls. Understanding NYC building compliance requirements is essential for properties in the city’s regulatory environment.

    Tenant Operations and Data Center Considerations

    Properties housing tenant data centers or providing managed connectivity services have contractual SLAs that create binding recovery obligations. The DRP must align building-level recovery (power, cooling, network) with tenant-level expectations. This requires coordination between the property management team’s DR plan and each tenant’s DR plan – a process that should be formalized in lease agreements and tested jointly.

    Portfolio-Level Recovery Prioritization

    Real estate organizations with multi-property portfolios must prioritize recovery across properties, not just across systems within a single property. A regional disaster affecting multiple buildings simultaneously forces triage decisions. The BIA should extend to property-level impact analysis: which buildings generate the most revenue, house the most critical tenants, or face the most severe regulatory consequences if operations are disrupted. Property-level risk assessment informs this prioritization, and property insurance structures should align with recovery tier assignments.

    ESG and Governance: Disaster Recovery as a Board-Level Imperative

    Disaster recovery has moved from the server room to the boardroom. ESG reporting frameworks now treat operational resilience as a governance indicator. Investors evaluate disaster recovery maturity as a proxy for management quality and climate risk preparedness.

    The governance dimension includes:

    • Board oversight: The board or a designated committee must review and approve the DRP, receive regular testing reports, and be briefed on material changes to the risk landscape
    • Budget accountability: DR funding must be adequate to meet the RTOs and RPOs established by the BIA. Underfunding the DRP while reporting resilience to stakeholders is a governance failure
    • Third-party governance: Vendor and cloud provider disaster recovery capabilities must be assessed, contractually documented, and periodically validated. Catastrophe modeling can quantify the financial exposure when third-party recovery fails
    • Regulatory compliance: Maintaining current compliance with all applicable DR mandates and reporting obligations
    • Disclosure: Accurately representing DR capabilities and material risks in ESG reports, investor communications, and regulatory filings

    The ESG metrics relevant to disaster recovery include mean time to recovery (MTTR), DR test pass rates, percentage of critical systems covered by tested recovery procedures, and time since last full-scale simulation. These metrics belong in the governance dashboard alongside financial and environmental performance indicators.

    Building and Maintaining the Disaster Recovery Framework

    A disaster recovery plan is not a one-time project. It is a living operational document that must evolve with the organization’s technology environment, risk landscape, and regulatory obligations. The maintenance cycle includes:

    • Quarterly reviews: Update contact lists, verify credentials, confirm infrastructure changes are reflected in runbooks
    • Post-change updates: Any significant infrastructure change – new application deployment, cloud migration, office relocation, merger or acquisition – triggers a DRP review and update
    • Annual BIA refresh: Business priorities shift, new systems are deployed, regulatory requirements change. The BIA must be refreshed annually, and RTO/RPO targets must be revalidated
    • Post-incident reviews: Any actual disaster or near-miss event produces lessons learned that feed back into the plan
    • Regulatory monitoring: Track changes to applicable compliance frameworks and adjust the DRP accordingly

    The disaster recovery planning lifecycle provides a structured approach to this ongoing maintenance, ensuring that the plan reflects current reality rather than historical assumptions.

    For organizations in the hospitality and commercial property sector, business continuity in the hotel industry illustrates how these principles apply to properties with 24/7 occupancy and guest safety obligations.

    Frequently Asked Questions

    What is the difference between a disaster recovery plan and a business continuity plan?

    A disaster recovery plan focuses specifically on restoring IT systems, data, and technology infrastructure after a disruption. A business continuity plan is broader, covering all operational functions including personnel, facilities, supply chains, and communications. The disaster recovery plan is a subset of the business continuity plan. Organizations need both: the BCP ensures the business keeps running during a disruption, while the DRP ensures the technology backbone is restored within acceptable timeframes defined by RTO and RPO metrics.

    How often should a disaster recovery plan be tested?

    Best practice calls for tabletop exercises quarterly, technical failover tests semi-annually, and full-scale disaster recovery simulations annually. Critical systems with aggressive RTOs may require monthly validation. ISO 22301 and NIST SP 800-34 both mandate regular testing with documented results. After any major infrastructure change, merger, or new regulatory requirement, an additional out-of-cycle test should be performed. Organizations subject to DORA must demonstrate testing results to regulators.

    What RTO and RPO values should my organization target?

    RTO and RPO targets depend on the criticality of each system as determined by a Business Impact Analysis. Tier 1 critical systems (financial transactions, emergency communications) typically require an RTO of under 1 hour and an RPO of near-zero. Tier 2 important systems (email, ERP) usually target 4-8 hour RTO with 1-4 hour RPO. Tier 3 standard systems may tolerate 24-72 hour RTO with 24-hour RPO. The key is aligning recovery targets with actual business impact – not aspirational goals that the budget cannot support.

    Is cloud-based disaster recovery sufficient, or do I still need on-premises recovery capabilities?

    Cloud-based DR and DRaaS solutions are sufficient for many workloads, but a hybrid approach is safer for most enterprises in 2026. Cloud DR offers rapid scalability and geographic redundancy, but introduces dependencies on internet connectivity, cloud provider availability, and third-party SLAs. Organizations with strict regulatory requirements, latency-sensitive applications, or operations in areas with unreliable connectivity should maintain on-premises recovery capabilities for critical systems. The 2024-2025 wave of major cloud outages demonstrated that cloud-only DR strategies carry concentration risk.

    More in NYC Business Continuity and About BC ESG.

    Related reading: Disaster recovery for CRE portfolios, LL97 continuity and insurance, and the Restoration Carbon Protocol. Sister hubs: Restoration Intel, Healthcare Facility Hub, Continuity Hub, Risk Coverage Hub, and Tygart Media.

    {
    “@context”: “https://schema.org”,
    “@type”: “FAQPage”,
    “mainEntity”: [
    {
    “@type”: “Question”,
    “name”: “What is the difference between a disaster recovery plan and a business continuity plan?”,
    “acceptedAnswer”: {
    “@type”: “Answer”,
    “text”: “A disaster recovery plan focuses specifically on restoring IT systems, data, and technology infrastructure after a disruption. A business continuity plan is broader, covering all operational functions including personnel, facilities, supply chains, and communications. The disaster recovery plan is a subset of the business continuity plan. Organizations need both: the BCP ensures the business keeps running during a disruption, while the DRP ensures the technology backbone is restored within acceptable timeframes defined by RTO and RPO metrics.”
    }
    },
    {
    “@type”: “Question”,
    “name”: “How often should a disaster recovery plan be tested?”,
    “acceptedAnswer”: {
    “@type”: “Answer”,
    “text”: “Best practice calls for tabletop exercises quarterly, technical failover tests semi-annually, and full-scale disaster recovery simulations annually. Critical systems with aggressive RTOs may require monthly validation. ISO 22301 and NIST SP 800-34 both mandate regular testing with documented results. After any major infrastructure change, merger, or new regulatory requirement, an additional out-of-cycle test should be performed. Organizations subject to DORA must demonstrate testing results to regulators.”
    }
    },
    {
    “@type”: “Question”,
    “name”: “What RTO and RPO values should my organization target?”,
    “acceptedAnswer”: {
    “@type”: “Answer”,
    “text”: “RTO and RPO targets depend on the criticality of each system as determined by a Business Impact Analysis (BIA). Tier 1 critical systems (financial transactions, emergency communications) typically require an RTO of under 1 hour and an RPO of near-zero. Tier 2 important systems (email, ERP) usually target 4-8 hour RTO with 1-4 hour RPO. Tier 3 standard systems may tolerate 24-72 hour RTO with 24-hour RPO. The key is aligning recovery targets with actual business impact – not aspirational goals that the budget cannot support.”
    }
    },
    {
    “@type”: “Question”,
    “name”: “Is cloud-based disaster recovery sufficient, or do I still need on-premises recovery capabilities?”,
    “acceptedAnswer”: {
    “@type”: “Answer”,
    “text”: “Cloud-based DR and DRaaS solutions are sufficient for many workloads, but a hybrid approach is safer for most enterprises in 2026. Cloud DR offers rapid scalability and geographic redundancy, but introduces dependencies on internet connectivity, cloud provider availability, and third-party SLAs. Organizations with strict regulatory requirements, latency-sensitive applications, or operations in areas with unreliable connectivity should maintain on-premises recovery capabilities for critical systems. The 2024-2025 wave of major cloud outages demonstrated that cloud-only DR strategies carry concentration risk.”
    }
    }
    ]
    }
    {
    “@context”: “https://schema.org”,
    “@type”: “BreadcrumbList”,
    “itemListElement”: [
    {
    “@type”: “ListItem”,
    “position”: 1,
    “name”: “Home”,
    “item”: “https://bcesg.org”
    },
    {
    “@type”: “ListItem”,
    “position”: 2,
    “name”: “Governance & ESG”,
    “item”: “https://bcesg.org/governance-esg-complete-professional-guide/”
    },
    {
    “@type”: “ListItem”,
    “position”: 3,
    “name”: “Disaster Recovery Plan: The Complete Framework for Business and IT Resilience (2026)”,
    “item”: “https://bcesg.org/disaster-recovery-plan-complete-framework-2026/”
    }
    ]
    }
  • Best ESG Practices for CRE Owners, REITs, and Developers (2026)

    Best ESG Practices for CRE Owners, REITs, and Developers (2026)

    Updated October 6, 2026. By Will Tygart.

    Updated Nov 2, 2026 — added the free CRE ESG quick card, GRESB-ready program pack, and CRE ESG program designer bot book downloads to this guide.

    How leading CRE owners, REITs, and developers structure ESG: net-zero targets, GRESB, LEED, ISSB/CSRD reporting, and what a mid-market portfolio can copy this year. Advisory firms are vendors. This page is the program design – not a directory.

    Instant CRE ESG Program Architecture Downloads

    Equip Your Real Estate Sustainability Team or Feed Your AI Assistant

    Grounded strictly in validated CRE leader benchmarks, GRESB Real Estate Assessment modules, LEED v5, and municipal Building Performance Standards. Zero letter-grade chasing—operational field tools, audit checklists, and AI routines.

    Field Reference FREE

    CRE ESG Quick Card

    2-page printable field card: validated net-zero-by-2040 backbone, annual GRESB 5-star / Green Star target, LEED/BREEAM/ENERGY STAR portfolio status, and the six things a GRESB-ready program file must name.

    Download Free PDF

    Direct download • No email gate

    Working Pack $7

    GRESB-Ready CRE ESG Program Pack

    6-page fillable working pack: GRESB-Ready Program File Checklist (6 nameable items with evidence fields), Best-in-Class Rubric Self-Score Worksheet (8 attributes, 24-pt scale), Net-Zero Credibility Checklist, Certification & Framework Tracker, and Capital-Stack Underwriting Note Sheet.

    Get Program Pack ($7) →

    Instant checkout • Square verified

    AI Intensive
    Book for Bots $17

    CRE ESG Program Designer Bot Book

    Feed to Claude, ChatGPT, Gemini, or NotebookLM: 4 AI-run routines (/gresb-audit, /netzero-validate, /midmarket-plan, /disclosure-map) plus embedded output router (/route ic-memo, gresb-preflight, lender-file, board-deck, green-lease).

    Get Bot Book ($17) →

    Software made of words • Instant delivery

    What a GRESB-ready program can name

    1. Coverage of standing assets vs development
    2. Data quality / estimation vs meters
    3. Targets that match intensity and cap
    4. Tenant engagement that shows up in energy
    5. Physical-risk overlay
    6. Board oversight

    Do not let letter-grade chasing replace this file. Read the score-interpreter FAQ on ESG ratings compared, then the climate-risk guide, CRE disaster recovery, and green bonds / ICMA.


    The leading commercial real estate (CRE) ESG programs share a common backbone: a validated net-zero-by-2040 target covering Scopes 1, 2, and 3; annual GRESB benchmarking with a 5-star rating and “Green Star” recognition; a portfolio certified to LEED, BREEAM, and ENERGY STAR; and disclosure aligned to the ISSB (IFRS S1/S2), GRI, and, where in scope, the EU CSRD. As of 2025, firms such as Prologis (net zero by 2040), JLL and CBRE (both SBTi-validated net zero by 2040), BXP, Kilroy, Hines, Brookfield, and Tishman Speyer set the pace. What separates a best-in-class program from a marketing claim is third-party validation of targets, audited data, embodied-carbon (Scope 3) accountability, and capital actually deployed against the plan.

    What does an ESG program actually mean in commercial real estate?

    In CRE, “ESG” is the discipline of measuring and managing a building portfolio’s environmental footprint, social impact, and governance quality, then disclosing that performance to investors, lenders, tenants, and regulators. Because buildings account for roughly a third or more of global energy-related emissions, the environmental pillar dominates: energy and water efficiency, on-site and procured renewables, waste diversion, and the carbon embedded in construction materials. The social pillar covers tenant health and wellbeing, community investment, diversity, and workforce practices. Governance covers board oversight of climate risk, data assurance, executive compensation tied to ESG metrics, and ethics. For owners and REITs, ESG is increasingly financial rather than reputational. Green-certified, energy-efficient assets command rent and valuation premiums, qualify for green financing, and face lower obsolescence risk as building-performance standards (BPS) and embodied-carbon rules spread across U.S. and European cities. For services firms such as JLL and CBRE, ESG is also a product line: they advise owners on decarbonization and manage millions of square feet against client sustainability goals.

    How do leading CRE firms structure their ESG programs?

    A best-in-class CRE ESG program is built on five structural elements: a science-aligned decarbonization target, a benchmarking and certification regime, a data-and-assurance backbone, governance with board-level accountability, and transparent reporting under recognized frameworks. The strongest programs treat these as an integrated system rather than separate initiatives.

    Net-zero and carbon-reduction targets

    The current standard is a long-dated net-zero target supported by near-term interim milestones, ideally validated by the Science Based Targets initiative (SBTi). Examples reported by the companies themselves:
    • Prologis has committed to net zero emissions by 2040 across Scopes 1, 2, and 3, with interim goals including 1 gigawatt of solar generation (plus storage) and submission of its net-zero target to the SBTi for validation. Because most of Prologis’s footprint is Scope 3, progress depends on customer and supply-chain partnership rather than direct control.
    • JLL was one of the first seven companies to receive SBTi-validated net-zero targets under the Net-Zero Standard in October 2021, committing to net zero across its value chain by 2040, with absolute reductions of 51% by 2030 and 95% by 2040.
    • CBRE has committed to net zero across its value chain by 2040, with SBTi-validated near-term 2030 targets to cut Scope 1 and 2 by 50% and emissions from managed properties by 55% per square foot from a 2019 baseline.
    • BXP (formerly Boston Properties) pursued carbon-neutral operations and set an emissions target aligned to a 1.5°C trajectory under the SBTi.
    • Kilroy Realty reports achieving carbon-neutral operations and has been recognized by GRESB as a regional sustainability leader among publicly traded real estate companies in the Americas.
    • Tishman Speyer has committed to net zero carbon emissions by 2050.
    The credibility test is not the headline year but the structure beneath it: a baseline year, interim targets, third-party validation, and an explicit plan for Scope 3, which for most owners is the largest and hardest category.

    GRESB benchmarking

    GRESB (the Global Real Estate Sustainability Benchmark) is the de facto ESG benchmark for the sector. In the 2025 Real Estate Assessment, 1,002 fund managers submitted 2,382 assessments, with the Standing Investments average score rising to 79 and Development to 87.9; a new Residential Component debuted at 80.1. Leading firms participate every year, target a 5-star rating (the top quintile), and earn “Green Star” recognition for balancing strong management with strong performance. GRESB scores are widely used by institutional investors to compare funds and to drive engagement, so a high, improving GRESB result is one of the clearest external signals of a serious program.

    Green-building certifications

    Certifications translate building performance into a market-recognized label. The three most common in CRE differ in geography, scope, and method:
    Certification Owner / scope Primary geography What it measures 2025 note
    LEED U.S. Green Building Council (USGBC); design, construction, operations U.S. and global Holistic: energy, water, materials, indoor environment, location LEED v5 launched April 28, 2025; certification opened Nov 3, 2025. About 50% of credits now tied to decarbonization; Platinum requires minimum carbon reductions and effectively fully electric systems.
    BREEAM Building Research Establishment (BRE); uses licensed assessors UK and Europe Weighted scoring across categories; results expressed as a percentage Dominant benchmark in European portfolios; assessor-verified evidence.
    ENERGY STAR U.S. EPA; operational benchmarking U.S. Energy-efficiency performance only (1-100 score) Narrower than LEED/BREEAM; widely used as an operational baseline across U.S. portfolios.
    BXP, for example, has reported certifying roughly 34 million square feet of its portfolio to LEED, with most of its actively managed office space certified and a large share at Gold and Platinum levels. The strongest programs use ENERGY STAR for operational benchmarking, LEED or BREEAM for whole-asset certification, and increasingly track WELL or Fitwel for the health/social dimension.

    Embodied carbon and Scope 3

    The frontier of CRE ESG is embodied carbon, the emissions locked into concrete, steel, and other materials before a building opens. Per the GHG Protocol, embodied carbon almost always lands in Scope 3 (Purchased Goods and Services, Capital Goods, and transportation), and for developers it can rival or exceed decades of operational emissions. Leading developers now require Environmental Product Declarations (EPDs) to compare and select lower-carbon materials, calculate whole-life carbon, and specify low-carbon concrete and steel. Regulators are catching up: California’s climate-disclosure laws phase in large-company reporting including Scope 3 on 2026 data, and cities from Boston to Los Angeles are weighing embodied-carbon limits in building permits. A program that reports only operational (Scope 1 and 2) emissions while ignoring embodied carbon is incomplete by current standards.

    Social and governance practices

    On the social side, leaders invest in tenant health (air quality, daylight, amenities), community development, affordable or workforce housing where relevant, and supplier diversity. On governance, the markers are board- or committee-level oversight of climate risk (BXP, for instance, established a board sustainability committee), third-party assurance of ESG data, linkage of executive compensation to sustainability KPIs, and clear climate-risk scenario analysis. Governance is what makes the environmental and social claims auditable rather than aspirational.

    What reporting frameworks do CRE companies use?

    Disclosure has consolidated rapidly. The key frameworks a CRE sustainability lead should know in 2025-2026:
    • ISSB (IFRS S1 and S2) are the emerging global baseline. IFRS S2 fully incorporates the TCFD recommendations and, in effect, replaces TCFD, which disbanded on January 1, 2024, with the IFRS Foundation assuming its monitoring role. By mid-2025, more than 30 jurisdictions representing over 60% of global GDP had committed to adopting or aligning with the ISSB standards. The ISSB issued amendments in 2025 to ease implementation of certain Scope 3 GHG disclosures.
    • GRI (Global Reporting Initiative) remains the most widely used framework for multi-stakeholder impact reporting and uses a double-materiality lens.
    • TCFD (Task Force on Climate-related Financial Disclosures) is now legacy but its four-pillar structure (governance, strategy, risk management, metrics and targets) lives on inside IFRS S2.
    • EU CSRD (Corporate Sustainability Reporting Directive) requires reporting under the European Sustainability Reporting Standards (ESRS) on a double-materiality basis. The 2025 “Omnibus I” simplification narrows scope to EU entities with more than 1,000 employees and over €450 million net turnover, cutting the number of in-scope companies sharply and reducing ESRS data points; the changes enter into force on March 18, 2026, with member states given 12 months to transpose them.
    The practical implication: ISSB and CSRD differ on materiality. ISSB looks only at financial materiality (how sustainability affects the business), while CSRD and GRI apply double materiality (also how the business affects people and the environment). A global CRE firm typically maps its disclosures to both.

    Why is GRESB the key ESG benchmark for CRE?

    GRESB matters because it is investor-driven and asset-specific. Unlike a generic corporate ESG rating, GRESB scores real-estate funds and portfolios on a standardized methodology covering both management (policies, governance, stakeholder engagement) and performance (energy, GHG, water, waste, certifications, data coverage). Institutional capital allocators use GRESB results in due diligence and ongoing engagement, which gives the benchmark real teeth: a slipping GRESB score can trigger investor questions, while a 5-star “Green Star” result is a credible, comparable signal. Because the 2025 cycle drew over 2,300 assessments globally, GRESB also functions as the industry’s largest pooled dataset, letting managers benchmark against true peers rather than self-selected narratives.

    What distinguishes a best-in-class CRE ESG program? (A rubric)

    Use the following rubric to separate leading programs from box-checking. Leaders score “strong” across most rows; laggards cluster in “basic” or “absent.”
    Attribute Best-in-class (strong) Developing (basic) Laggard (absent)
    Decarbonization target SBTi-validated net zero by 2040, interim 2030 milestones, all scopes Self-set net-zero year, no validation No target or operations-only
    Scope 3 / embodied carbon Measured and managed; EPDs and whole-life carbon for new development Scope 3 estimated, embodied carbon not addressed Scope 1 and 2 only
    GRESB Annual participation, 5-star, Green Star, improving trend Participates, mid-tier score Does not participate
    Certifications Majority of portfolio LEED/BREEAM; ENERGY STAR benchmarking; WELL/Fitwel for health Flagship assets certified only No certifications
    Data and assurance Audited/third-party-assured data, high coverage, like-for-like tracking Self-reported, partial coverage Anecdotal or absent
    Reporting frameworks ISSB/IFRS S2, GRI, CSRD where in scope One framework, partial alignment Press-release-only
    Governance Board/committee oversight, exec comp linked to ESG KPIs Management-level only No formal oversight
    Capital deployment Funded retrofit/renewable pipeline, green financing Pilots only No capital committed
    The single most important distinction is the gap between targets and execution. A validated 2040 net-zero target is only credible if it is paired with funded retrofits, on-site or contracted renewables, assured data, and a real Scope 3 plan. Programs that publish ambitious commitments without capital, coverage, or assurance behind them are, by current professional standards, incomplete.
    GRESB, Net-Zero & BPS Operational Toolkit

    Operationalize Your GRESB & Decarbonization Program File

    Ambitious sustainability targets are common in commercial real estate; what separates leaders from marketing claims is third-party validation, audited data, embodied-carbon accountability, and capital actually deployed. Whether you need printable working checklists, rubric score sheets, and BPS capital-stack underwriting sheets, or structured prompts to audit your program file inside your own AI assistant, these tools provide an immediate, auditable pathway for CRE owners, REITs, and developers.

    📋

    What’s In The Toolkit:

    • GRESB-Ready File Checklist: 6 nameable items with documentary evidence fields.
    • Best-in-Class Rubric: 8 attributes scored across 24 points.
    • Net-Zero Credibility Checklist: Baseline, 2030 milestones, SBTi, CapEx.
    • Framework Tracker: LEED v5, BREEAM, ENERGY STAR, ISSB, CSRD.
    • Capital-Stack Note Sheet: BPS fines (LL97, BEPS, BERDO), NOI hit, Brown Discount.
    • AI Bot Book Routines: 4 interactive workflows & output router ($17).
    Secure 1-Click Square Checkout

    How should an asset or REIT investor evaluate a CRE ESG program?

    Start with the disclosures, not the marketing. Pull the company’s latest sustainability or annual ESG report and its GRESB result, then check: Is the net-zero target SBTi-validated, and does it cover Scope 3? What share of the portfolio is certified and ENERGY STAR-benchmarked? Is the emissions data third-party assured, and what is the data-coverage percentage? Is there board-level governance and exec-comp linkage? For new development, is embodied carbon measured? Finally, look for a funded transition plan, because the strongest signal a program is real is capital flowing into retrofits, electrification, and renewables, not just a commitment slide.

    Choose Your CRE ESG Program Architecture Toolkit

    Grounded directly in published CRE leader commitments, GRESB benchmarking, LEED v5, ISSB S1/S2, and municipal BPS compliance economics.

    Quick Reference

    CRE ESG Quick Card

    FREE

    2-page printable field card: validated net-zero-by-2040 backbone, GRESB 5-star / Green Star target, LEED/BREEAM/ENERGY STAR status, and the 6 nameable file items.

    Download Free PDF
    Working Pack

    GRESB-Ready CRE ESG Pack

    $7

    6-page fillable working pack: GRESB-Ready Program File Checklist (6 items), Best-in-Class Rubric (24 pts), Net-Zero Credibility Checklist, Framework Tracker, and BPS Capital-Stack Sheet.

    Buy Now ($7) →
    AI Intensive

    CRE ESG Designer Bot Book

    $17

    8-page feed-to-AI operating system: 4 AI-run routines (/gresb-audit, /netzero-validate, /midmarket-plan, /disclosure-map) plus embedded output router.

    Buy Now ($17) →

    Frequently asked questions

    What is GRESB and why does it matter in CRE?

    GRESB is the Global Real Estate Sustainability Benchmark, an investor-driven standard that scores real-estate funds and portfolios on management and performance. In 2025 it drew 1,002 fund managers and 2,382 assessments. Institutional investors use GRESB scores in due diligence, so a 5-star “Green Star” rating is a widely trusted signal of a strong ESG program.

    What is the difference between LEED, BREEAM, and ENERGY STAR?

    LEED (USGBC, U.S.-led and global) and BREEAM (BRE, UK and Europe) are holistic, whole-building certifications covering energy, water, materials, and indoor environment; BREEAM uses licensed assessors and percentage scores, while LEED uses points. ENERGY STAR (U.S. EPA) is narrower, scoring only operational energy efficiency. LEED v5, launched in 2025, ties about half its credits to decarbonization.

    What net-zero targets have major CRE firms set?

    Prologis targets net zero by 2040 across all scopes. JLL and CBRE both target net zero across their value chains by 2040 with SBTi-validated interim 2030 goals. Tishman Speyer has committed to net zero by 2050, and Kilroy reports carbon-neutral operations. The credibility marker is SBTi validation plus a Scope 3 plan, not the headline year alone.

    What is embodied carbon and why is it now central to CRE ESG?

    Embodied carbon is the emissions tied to producing and installing building materials such as concrete and steel. Per the GHG Protocol it falls under Scope 3, and for new development it can rival decades of operational emissions. Leaders use Environmental Product Declarations (EPDs) and whole-life carbon analysis, and regulators in California and several cities are moving to require disclosure or limits.

    Is TCFD still required, or has ISSB replaced it?

    TCFD disbanded on January 1, 2024, and its recommendations are now embedded in the ISSB’s IFRS S2 standard, which the IFRS Foundation oversees. Companies that previously reported to TCFD generally transition to IFRS S1 and S2, which more than 30 jurisdictions have committed to adopt or align with as of mid-2025.

    How does the EU CSRD affect U.S. CRE firms?

    CSRD requires reporting under the ESRS on a double-materiality basis and can reach non-EU groups with significant EU operations. The 2025 “Omnibus I” package narrowed scope to entities with more than 1,000 employees and over €450 million net turnover and cut ESRS data points; the revisions enter into force on March 18, 2026. U.S. CRE firms with large European footprints should confirm whether they remain in scope.

    What single factor best signals a credible CRE ESG program?

    Capital deployment against a validated plan. Ambitious targets are common; what distinguishes leaders is funded retrofits, electrification, contracted renewables, high data coverage with third-party assurance, and a concrete Scope 3 strategy. A strong, improving GRESB score plus SBTi-validated targets is the fastest external proxy for that underlying execution.

    Sources & further reading

    More in Environmental and About BC ESG.

    Related reading: GRESB scoring levers for property managers, mid-market ESG disclosure templates, and the Restoration Carbon Protocol. Sister hubs: Restoration Intel, Healthcare Facility Hub, Continuity Hub, Risk Coverage Hub, and Tygart Media.

    What non-compliance does to the capital stack

    A program file like the one above is the operational answer. The financial question sits one floor up, and it is where municipal building performance standards \u2014 New York\u2019s LL97, the District\u2019s BEPS, Boston\u2019s BERDO, Denver\u2019s Energize Denver \u2014 actually bite.

    Penalties are an NOI line, not a legal footnote. BPS fines recur annually for as long as a building is over its limit. A recurring penalty is an operating expense: it reduces net operating income dollar for dollar, every year, and it does so in the line a buyer capitalises. That is the arithmetic behind the market\u2019s \u201cbrown discount\u201d \u2014 offers on non-compliant assets get priced down by the expected penalties plus the retrofit capital expenditure still to come, because the buyer is underwriting both.

    Lenders now ask. BPS compliance status has entered acquisition and refinancing diligence: expect the data room request to include benchmarking filings, compliance-pathway elections and any penalty or mitigation correspondence. Where the answers are weak, the consequences are the standard lender toolkit \u2014 more conservative leverage, debt-service-coverage covenants with less headroom, or mandatory CapEx reserve escrows that trap cash until the retrofit work is done. None of that requires a lender to care about carbon; it only requires them to price a known, recurring, regulator-enforced cost.

    Leases decide who pays. Whether a penalty or a retrofit dollar lands on the owner or the tenant is a drafting question \u2014 capital-cost recovery and pass-through clauses written before these standards existed rarely contemplated them. A green-leasing review that allocates compliance costs, data-sharing duties and retrofit access explicitly is cheaper than the first dispute over a fine.

    The practical sequence follows: get the compliance position documented (the program file), quantify the penalty exposure and retrofit CapEx (the underwriting file), and put both in front of lenders and buyers before they find them in diligence. Surprises are what get priced punitively; documented plans are what get financed.

  • Business Continuity in the Hotel Industry: Resilience and Continuity Planning for Hospitality

    Business Continuity in the Hotel Industry: Resilience and Continuity Planning for Hospitality

    Updated October 6, 2026.

    Updated Nov 2, 2026 — added the free hotel continuity quick card, grab-and-go BIA/RTO/RPO pack, and hotel resilience AI operator downloads to this guide.

    Hotel Business Continuity Quick Card (2-Page PDF)
    ISO 22301 PDCA lifecycle, core hospitality threat table (weather, ransomware, power, pandemic, staffing), and guest life-safety checklist.
    Download Free Quick Card (PDF)

    If you run resilience for hotels or hospitality portfolios, this guide maps ISO 22301 business continuity to guest safety, brand protection, and ESG-linked operational risk in 2026.

    Business continuity in the hotel industry is the discipline of keeping a property safe, operational, and revenue-generating through disruptions such as hurricanes, cyberattacks, power loss, pandemics, and staffing crises. The internationally recognized framework is ISO 22301, the standard for business continuity management systems (BCMS), which runs on a Plan-Do-Check-Act lifecycle built around a Business Impact Analysis (BIA), defined Recovery Time and Recovery Point Objectives (RTO/RPO), tested recovery strategies, and rehearsed crisis communications. For hotels, the stakes are unusually high because the asset, the workforce, the guests, and the data systems all sit under one roof, and a single outage can simultaneously threaten life safety, brand reputation, and asset value.

    Instant Hotel Resilience Downloads

    Equip Your Property Operations or Feed Your AI Assistant

    Grounded strictly in ISO 22301:2019/Amd 1:2024 and NFPA life-safety standards. Practical operational tools, field worksheets, and AI prompts for hotel general managers, resilience leads, and hospitality portfolio directors.

    Field Reference FREE

    Hotel Continuity Quick Card

    2-page field card: hotel business continuity vs IT disaster recovery, ISO 22301 Plan-Do-Check-Act lifecycle, core threat table (weather, ransomware, power, pandemic, staffing), and 24/7 guest life-safety integration.

    Download Free PDF

    Direct download • No email gate

    Working Pack $7

    Hotel Continuity Grab-and-Go Pack

    6-page fillable working pack: Threat Quick-Reference Sheet (with ~$4.03M breach cost & 20–50% premium hikes), Hotel BIA Worksheet, RTO/RPO Target Sheet, Life-Safety Integration Checklist, Cyber Resilience Checklist, and Test & Maintenance Log.

    Get Grab-and-Go Pack ($7) →

    Instant checkout • Square verified

    AI Intensive
    Book for Bots $17

    Hotel Resilience AI Operator

    6-page feed-to-AI operating system: 4 AI-run routines (/bia, /rto, /cyber, /exercise) covering hotel BIA scoring, RTO/RPO architecture, cyber breach auditing, and exercise planning with embedded output router.

    Get AI Operator ($17) →

    Software made of words • Instant delivery

    What is business continuity in the hotel industry?

    Business continuity (BC) is the capability of a hotel to continue delivering products and services at acceptable, predefined levels following a disruptive incident. It is broader than disaster recovery, which focuses narrowly on restoring IT systems and data. Business continuity covers the whole operation: front desk and reservations, housekeeping, food and beverage, the property management system (PMS), payment processing, life-safety systems, guest communications, and the supply chain that feeds linens, food, and energy into the building.

    Hotels are a uniquely concentrated risk environment. Unlike an office that empties at night, a hotel is occupied 24 hours a day by guests who depend on the property for shelter, safety, and information during an emergency. A continuity failure is therefore not only a financial event but potentially a life-safety event. This is why mature hotel BC programs integrate emergency response and life safety directly into the continuity plan rather than treating them as separate documents.

    What are the biggest threats to hotel business continuity?

    The hospitality risk landscape in 2024-2026 is defined by the convergence of physical, digital, and human threats. Extreme weather is intensifying, ransomware has become an industry-wide epidemic, and labor shortages have made it harder to staff a coordinated response. The table below summarizes the leading threats, their operational impact, and core mitigations.

    Threat Operational impact Core mitigation
    Natural disasters & extreme weather (hurricanes, floods, wildfire, extreme heat) Property damage, forced closure, evacuation, lost occupancy; insurers raising premiums 20-50% or withdrawing from high-risk areas Resilient construction to current flood/wind codes, flood barriers, backup power, pre-arranged evacuation and sheltering protocols, parametric insurance
    Cyberattacks & guest-data breaches (ransomware, social engineering) PMS and payment outages, theft of guest PII and card data, regulatory investigations; average hospitality breach cost ~$4.03M in 2025 Multi-factor authentication, help-desk verification procedures, network segmentation, immutable offline backups, PCI DSS compliance, incident response plan
    Power & utility failure Loss of HVAC, lighting, electronic locks, PMS, refrigeration; immediate guest-safety and comfort impact Generators with tested fuel supply, uninterruptible power supply (UPS) for critical systems, manual override procedures for door locks and check-in
    Pandemics & public-health events Demand collapse, occupancy crashes, workforce illness, sustained operating-model changes Flexible staffing models, hygiene and isolation protocols, scenario-based demand planning, cross-training, liquidity reserves
    Supply-chain disruption Shortages of food, linens, amenities, and critical spare parts; price volatility Diversified and local suppliers, safety stock of critical items, vendor continuity clauses, alternate-sourcing playbooks
    Staffing & labor shortages Inability to clean rooms, staff the response, or maintain service; recovery delays Cross-training, retention incentives, automation of low-value tasks, on-call and agency rosters, documented emergency duty assignments

    How serious is the cyber threat to hotels specifically?

    Cyber risk has moved to the front of the hotel continuity agenda. The 2023 attack on MGM Resorts International cost the company more than $100 million and was executed by the Scattered Spider group through a single social-engineering (vishing) call to the IT help desk, where an attacker impersonated an employee and obtained super-administrator access. On March 29, 2024, Omni Hotels & Resorts suffered an attack that forced systems offline and disrupted reservations, payment processing, and digital room-key access across many properties. In 2024, a breach at hotel-technology vendor Otelier exposed data tied to brands including Marriott, Hilton, and Hyatt, adding roughly half a million accounts to breach-notification databases. According to the 2025 Verizon Data Breach Investigations Report, ransomware features in 44% of breaches, and the average cost of a hospitality data breach reached approximately $4.03 million in 2025. The lesson for continuity planners is that the weakest link is often a process (help-desk verification) rather than a firewall.

    How does extreme weather threaten hotel continuity and value?

    2024 was the warmest year in the observational record, accompanied by an extraordinary run of extreme events. The financial tail is long: arrivals to the Hawaiian island of Maui were still down 24% a year after the 2023 wildfires, representing an estimated US$2.6 billion impact. During the 2024 Atlantic hurricane season, Hurricane Milton damaged or closed roughly a quarter of hotels in directly impacted Florida markets, according to JLL Hotels & Hospitality Group, while properties built to current standards for flooding, storm surge, and high winds suffered minimal damage. Annual climate-related economic losses exceeded US$230 billion per year during 2015-2024. For hotel real estate, this translates into rising insurance costs, restricted coverage in coastal zones, and growing investor scrutiny of physical climate exposure.

    What is the business continuity planning lifecycle for a hotel?

    ISO 22301 organizes continuity around a continuous Plan-Do-Check-Act (PDCA) lifecycle rather than a one-time document. The core phases below apply directly to a hotel.

    Phase What it produces Hotel-specific focus
    1. Business Impact Analysis (BIA) & risk assessment Inventory of critical functions, maximum tolerable downtime, dependencies Reservations/PMS, payment processing, electronic locks, life safety, housekeeping, F&B, guest communications
    2. Set RTO and RPO targets Recovery deadlines and acceptable data-loss windows per function Payment and PMS typically demand the shortest RTO/RPO; back-office can tolerate longer
    3. Recovery strategies Backup systems, manual workarounds, alternate sites, redundancy Manual check-in procedures, offline lock overrides, cloud PMS failover, generator power
    4. Plan development & emergency response Written BC plan, incident response, evacuation and life-safety procedures Integrated with NFPA 101 life-safety and fire procedures; clear duty assignments
    5. Crisis communications Pre-drafted messaging, contact trees, spokesperson roles Guests, staff, suppliers, owners/brand, media, and authorities
    6. Testing & exercises Validated, rehearsed plan; identified gaps Tabletop and full-scale drills; learning captured from real events
    7. Review & continual improvement Updated plan reflecting changes and lessons learned Refresh after staff turnover, renovations, system changes, and incidents

    What is a Business Impact Analysis for a hotel?

    The Business Impact Analysis (BIA) is the foundation of the entire program. It identifies the hotel’s critical functions, quantifies how long each can be offline before unacceptable harm occurs, and maps the dependencies between them. For a hotel, the BIA typically prioritizes guest services, reservations, the PMS, payment processing, electronic door locks, life-safety systems, housekeeping, and food and beverage operations. The output of the BIA drives every downstream decision, because it tells planners where to concentrate scarce time, capital, and redundancy.

    What do RTO and RPO mean for hotel systems?

    Recovery Time Objective (RTO) is the maximum acceptable time a function can be down after a disruption. Recovery Point Objective (RPO) is the maximum acceptable amount of data loss, measured in time. In a hotel, payment processing and the PMS usually carry the most aggressive targets: an RTO measured in minutes to a few hours, and an RPO low enough that no completed reservation or folio charge is lost. A guest-loyalty analytics dashboard, by contrast, can tolerate an RTO of days. Setting these targets explicitly, per function, is what turns a vague aspiration (“get back up fast”) into an engineerable backup and failover design.

    Operational Resilience Toolkit

    Operationalize Your Hotel Continuity & Life-Safety Planning

    A single hotel outage can simultaneously threaten life safety, brand reputation, and asset value under one roof. Whether you need printable working logs, BIA worksheets, and cyber checklists for your property leadership team, or structured prompts to run compliance and downtime scoring inside your own AI assistant, these tools provide an immediate, auditable pathway grounded in ISO 22301 and NFPA life-safety standards.

    📋

    What’s In The Toolkit:

    • Hotel BIA Worksheet: 7 core hotel functions with downtime limits.
    • RTO/RPO Target Sheet: PMS, payments, locks & back-office deadlines.
    • Life-Safety Checklist: NFPA 101/13/72/25/96 operational verification.
    • Cyber Checklist: MFA, help-desk verification, segmentation & offline backups.
    • AI Bot Routines: 4 automated routines + output router ($17).
    Secure 1-Click Square Checkout

    How do hotels protect guest safety and life safety?

    Because guests sleep on the premises, life safety is the non-negotiable core of hotel continuity. In the United States, the governing framework is the NFPA 101 Life Safety Code, supported by NFPA 13 (sprinkler installation), NFPA 72 (fire alarm and signaling), NFPA 25 (inspection and maintenance of water-based suppression), and NFPA 96 (commercial cooking fire protection). Modern mid-rise and high-rise hotels generally require full sprinkler coverage, interconnected audible and visual fire alarms in all guest rooms and common areas, battery-backed emergency lighting, illuminated exit signage, and, in larger properties, an emergency voice/alarm communication system (EVACS) to direct occupants during an event. Sprinkler systems must be inspected and tested annually under NFPA 25, alarm notification devices require regular testing under NFPA 72, and staff must be trained to recognize alarms, locate the source, and execute response steps. A continuity plan that ignores these life-safety obligations is incomplete; conversely, a strong life-safety program is the first layer of resilience.

    How do hotels build cyber and IT resilience?

    IT resilience for hotels centers on three system families: the property management system (PMS), payment and point-of-sale systems, and the growing layer of IoT and smart-room devices (electronic locks, thermostats, voice assistants, building-management systems). Each is a continuity dependency and an attack surface.

    Practical measures include multi-factor authentication on all administrative and remote access; strict identity-verification procedures at the IT help desk to defeat the social-engineering tactics that breached MGM; network segmentation so that a compromised guest Wi-Fi or smart-room controller cannot reach the PMS or payment environment; immutable, offline backups tested against ransomware; and PCI DSS compliance for cardholder data. Cloud-based PMS platforms can improve resilience by enabling failover and off-site data, but they also create vendor dependencies; the Otelier breach showed that a third-party hotel-tech provider can become the single point of failure for multiple brands. A robust IT continuity plan therefore includes manual fallback procedures, such as paper check-in and offline lock overrides, so the front desk can keep operating even when systems are dark.

    What is ISO 22301 and why does it matter for hotels?

    ISO 22301 is the international standard for business continuity management systems. The current published edition is ISO 22301:2019, which streamlined the original 2012 version. In February 2024, ISO published Amendment 1 (ISO 22301:2019/Amd 1:2024), adding climate-action requirements that oblige organizations to consider how climate change may affect their operations and stakeholders, a direct concern for weather-exposed hotel assets. A further revision is under development through ISO/TC 292 and is anticipated to follow. ISO 22301 matters for hotels because it provides a recognized, auditable structure, certification can support insurance negotiations, and brand and owner agreements increasingly expect documented continuity capability. Insurers reward proactive risk management: hotels with thorough continuity plans are viewed as less likely to file large claims, which can translate into more favorable premiums and coverage terms.

    How does business continuity connect to ESG and resilience reporting?

    For institutionally owned hotel real estate, business continuity has become part of the environmental, social, and governance (ESG) story, specifically the resilience dimension. The GRESB Real Estate Assessment, widely used by institutional real estate investors, asks entities in its 2025 framework to describe how they incorporate resilience into their climate strategy, including whether scenario analysis is used to evaluate that strategy. Physical climate risks, flooding, heatwaves, and wildfires, are increasingly seen as material to asset value; nearly two in five respondents in a GRESB and MIPIM survey said physical climate impacts will have the biggest effect on asset values in 2026. The practical implication is that a hotel’s BIA, climate scenario analysis, recovery strategies, and tested response are no longer purely operational artifacts. They are inputs to investor reporting, capital access, and valuation. ISO 22301’s 2024 climate amendment and the resilience indicators in GRESB are converging: a well-run continuity program is now also an ESG asset.

    How should a hotel test and maintain its continuity plan?

    A plan that is never exercised is a liability, because gaps surface only during a real crisis. ISO 22301 requires that continuity procedures be exercised and tested regularly, appropriate to the organization’s activities and risk profile. The most accessible method is the tabletop exercise: a guided, scenario-based discussion that brings decision-makers together to walk through a crisis, such as a ransomware lockout during peak occupancy or an evacuation during a hurricane. Tabletops reveal policy and communication gaps and clarify each leader’s authority limits and decision rights without real-world pressure. More advanced programs add part-scale or full-scale exercises, such as a live failover of the PMS or a timed evacuation drill, and they treat real incidents as learning opportunities. Plans should be refreshed after major staff turnover, renovations, system migrations, and every actual incident, closing the Plan-Do-Check-Act loop.

    Choose Your Hotel Continuity & Resilience Toolkit

    Grounded directly in ISO 22301:2019/Amd 1:2024, NFPA life-safety codes, and published hospitality incident benchmarks.

    Quick Reference

    Hotel Continuity Quick Card

    FREE

    2-page printable field card: BC vs DR, ISO 22301 lifecycle, threat table, and 24/7 life-safety integration.

    Download Free PDF
    Working Pack

    Hotel Continuity Grab-and-Go Pack

    $7

    6-page fillable working pack: threat sheet, BIA worksheet, RTO/RPO targets, life-safety checklist, cyber checklist, and test log.

    Buy Now ($7) →
    AI Intensive

    Hotel Resilience AI Operator

    $17

    6-page feed-to-AI operating system: 4 AI-run routines (/bia, /rto, /cyber, /exercise) with embedded output router.

    Buy Now ($17) →

    Frequently asked questions

    What is the difference between business continuity and disaster recovery in a hotel?

    Disaster recovery is a subset of business continuity focused on restoring IT systems and data after an outage. Business continuity is broader: it keeps the whole hotel operation running, including front desk, housekeeping, life safety, supply chain, and guest communications, not just the technology.

    Which standard governs hotel business continuity?

    ISO 22301 is the international standard for business continuity management systems. The current edition is ISO 22301:2019, with a 2024 amendment adding climate-action requirements. In the United States, life-safety elements are governed separately by NFPA codes such as NFPA 101.

    What are RTO and RPO and which hotel systems need the tightest targets?

    RTO (Recovery Time Objective) is how fast a function must be restored; RPO (Recovery Point Objective) is how much data loss is acceptable. Payment processing and the property management system typically need the tightest targets, often an RTO of minutes to hours and a near-zero RPO so no reservation or charge is lost.

    What was the lesson of the MGM Resorts cyberattack for hotels?

    The 2023 MGM attack, which cost over $100 million, began with a single social-engineering phone call to the IT help desk that yielded administrator access. The lesson is that strong identity-verification procedures at the help desk and multi-factor authentication are as important to continuity as technical defenses.

    How often should a hotel test its business continuity plan?

    ISO 22301 calls for regular exercises appropriate to the organization’s risk profile. In practice, hotels should run at least an annual tabletop exercise, conduct life-safety and evacuation drills on the schedule their jurisdiction and NFPA codes require, and refresh the plan after any major change or real incident.

    Does business continuity affect a hotel’s insurance and asset value?

    Yes. Insurers view hotels with thorough continuity plans as lower-risk and may offer more favorable premiums and coverage terms. For institutionally owned properties, resilience and climate scenario analysis feed ESG frameworks such as GRESB, where physical climate risk is increasingly treated as material to asset value.

    How does a pandemic factor into hotel continuity planning?

    Pandemics create demand collapse and workforce illness simultaneously. Continuity plans address them through flexible staffing models, cross-training, hygiene and isolation protocols, scenario-based demand planning, and liquidity reserves. Many operators permanently streamlined staffing models after the COVID-19 period, blending labor reductions with technology-driven efficiency.

    Sources & further reading

    More in Climate Risk and About BC ESG.

    Related reading: property-management BCP, disaster recovery for CRE portfolios, and the Restoration Carbon Protocol. Sister hubs: Restoration Intel, Healthcare Facility Hub, Continuity Hub, Risk Coverage Hub, and Tygart Media.

  • ESG in Banking and Investment: Risk, Lending, and Disclosure

    ESG in Banking and Investment: Risk, Lending, and Disclosure

    Updated October 6, 2026.

    ESG in banking and investment means integrating environmental, social, and governance factors into credit risk, underwriting, lending, and portfolio construction, and disclosing those exposures under frameworks such as the ISSB’s IFRS S1/S2, the EU’s CSRD/ESRS and SFDR, and the Basel Committee’s voluntary climate-risk disclosure framework. The practice is now being reshaped by two opposing forces in 2025-2026: regulatory consolidation around the ISSB baseline globally, and a sharp US “anti-ESG” retreat that drove every major Wall Street bank out of the Net-Zero Banking Alliance (NZBA) between December 2024 and January 2025 and prompted the SEC to abandon and then move to rescind its 2024 climate-disclosure rules.

    What does ESG actually mean for a bank or asset manager?

    For financial institutions, ESG is not a marketing layer; it is a set of risk factors and a disclosure regime. On the banking side, ESG enters through credit risk: climate transition risk (stranded assets, carbon-pricing exposure), physical risk (flood, wildfire, and heat damage to collateral), and governance and reputational risk in counterparties. On the investment side, ESG enters portfolio management through screening, integration, thematic allocation, stewardship, and impact strategies. Both sides converge on one hard requirement: comparable, decision-useful disclosure. The dominant theme of 2025-2026 is that disclosure rules are simultaneously converging on the ISSB global baseline and being scaled back in scope, especially in the United States and the European Union.

    How is ESG used in credit risk, underwriting, and lending?

    Banks integrate ESG into underwriting primarily as a forward-looking risk overlay rather than a values screen. Climate transition risk can impair the creditworthiness of carbon-intensive borrowers as carbon costs rise and demand shifts; physical risk can destroy or devalue real-estate and infrastructure collateral. Supervisors increasingly expect banks to run climate scenario analysis, identify concentrations, and reflect material climate risk in their internal capital adequacy assessment. The European Central Bank, the Bank of England, and the US Federal Reserve have all run climate scenario exercises, though none currently impose an explicit climate capital add-on. In practice, ESG factors most often affect pricing, covenants, and concentration limits rather than the binary decision to lend.

    What are ESG-linked loans and sustainability-linked bonds?

    Two instrument families dominate sustainable finance, and they work differently:
    • Use-of-proceeds instruments (green/social/sustainability bonds and loans): capital is ring-fenced for defined eligible projects (renewables, clean transport, affordable housing). Green bonds remained the largest single category, at roughly 53-57% of labeled issuance through 2024-2025.
    • Sustainability-linked instruments (SLLs and SLBs): proceeds are general-purpose, but the coupon or margin steps up or down based on the borrower hitting predefined sustainability performance targets (KPIs/SPTs). These face the most greenwashing scrutiny because weak targets produce a label with little substance.
    The labeled bond market hit roughly USD 1 trillion to 1.1 trillion in 2024 (World Bank and Climate Bonds Initiative data), with cumulative labeled issuance reaching about USD 6.2 trillion by December 2024. The sustainability-linked segment has cooled markedly: S&P Global forecast only about USD 35 billion of SLB issuance for 2025, far below the 2021-2023 peak, and labeled loan volumes fell roughly 52% from H1 2024 to H1 2025 as borrowers dropped labels whose pricing benefit (often just a few basis points of margin step-down) no longer justified the verification burden. On 26 March 2025, the loan-market trade associations (LMA/LSTA/APLMA) tightened the Sustainability-Linked Loan Principles, making post-signing verification by a qualified external reviewer mandatory (“shall” rather than “should”).

    How do investment and asset-management firms integrate ESG?

    Asset managers deploy a spectrum of approaches, often within the same firm: negative/exclusionary screening (e.g., excluding controversial weapons or thermal coal), positive/best-in-class screening, full ESG integration into financial analysis, thematic and impact investing, and active ownership through proxy voting and engagement. Post-2023, the industry has shifted language from “ESG investing” toward “sustainable investing,” “transition finance,” and “responsible investing,” partly to sidestep US political controversy and partly to comply with tighter fund-naming rules. Stewardship and engagement remain widely practiced even where firms have muted public ESG branding.

    Which disclosure frameworks apply to financial institutions?

    A bank or asset manager operating across major markets faces an overlapping stack of frameworks. The single most important shift is that the ISSB’s IFRS S1 and S2 have become the global baseline, formally consolidating the legacy TCFD recommendations (the IFRS Foundation took over TCFD monitoring in 2024).
    Framework Issuer / jurisdiction Status (2025-2026) Relevance to financial institutions
    IFRS S1 / S2 (ISSB) IFRS Foundation (global) Global baseline; adopted or being adopted by 35+ jurisdictions representing more than half of global GDP Entity-wide sustainability and climate risk disclosure; absorbs TCFD; basis for UK, Hong Kong, Singapore, Brazil, Nigeria, Malaysia regimes
    CSRD / ESRS EU In force but scaled back by the 2025 “Omnibus” simplification package Mandatory double-materiality reporting for large EU banks and insurers; scope sharply reduced
    SFDR EU (ESMA/EC) Under “SFDR 2.0” overhaul (proposal Nov 2025) Product-level disclosure and de facto fund labeling for asset managers
    TCFD FSB (legacy) Disbanded 2023; monitoring absorbed by ISSB Still referenced in many national rules; superseded by IFRS S2
    Basel climate-risk disclosure BCBS Published 13 June 2025 as voluntary, not Pillar 3 Bank-specific climate-risk disclosure template; adoption left to national regulators
    SEC climate rules US SEC Stayed since April 2024; SEC moved to rescind in 2025-2026 Effectively defunct for US registrants

    What changed with the EU’s CSRD “Omnibus” package?

    In 2025 the EU enacted an “Omnibus” simplification that dramatically narrowed the Corporate Sustainability Reporting Directive. The final deal raised the mandatory threshold to EU companies with more than 1,000 employees and over EUR 450 million in net turnover, cutting the in-scope population by an estimated ~90% versus the original 250-employee threshold. EFRAG delivered simplified ESRS that reduce mandatory data points by roughly 60-70% (from about 1,073 to around 320). The Commission is expected to adopt the revised ESRS by delegated act around mid-2026, with effect potentially from FY2027. Large EU banks and insurers remain in scope, but value-chain data requests from smaller counterparties are now capped.

    How do SFDR’s Article 6, 8, and 9 categories work, and what is “SFDR 2.0”?

    The EU Sustainable Finance Disclosure Regulation (SFDR) was designed as a disclosure regime but was used by the market as a labeling system. Almost half of EU assets under management sit in Article 8 or Article 9 products.
    SFDR classification Plain-language meaning Market nickname
    Article 6 No sustainability focus, or ESG risks merely considered; baseline disclosure “Non-ESG”
    Article 8 Promotes environmental or social characteristics “Light green”
    Article 9 Has sustainable investment as its objective “Dark green”
    In November 2025 the European Commission proposed “SFDR 2.0,” replacing the Article 8/9 regime with three formal product categories – broadly Sustainable, Transition, and ESG (collection/basics) – each anchored by a roughly 70% portfolio threshold, common exclusions, and short-form disclosures. The legislative process is expected to run through 2026-2027, with application unlikely before 2028. Until then, the Article 6/8/9 framework remains in force.

    What do fund-naming and greenwashing rules require?

    Two regimes police the gap between a fund’s name and its holdings. In the EU, ESMA’s fund-naming guidelines took effect in 2024 with a compliance deadline of May 2025: funds using ESG, “sustainable,” “impact,” or environmental terms such as “green” must invest at least 80% of assets in line with the relevant characteristics and apply Paris-Aligned Benchmark exclusions. The effect was immediate – per an ESMA study of 924 funds, about 64% changed their names ahead of the deadline, with many simply dropping ESG terminology rather than greening portfolios. In the United States, the SEC’s amended Names Rule (adopted September 2023) extended the longstanding “80% investment policy” to fund names suggesting “particular characteristics,” explicitly capturing ESG and sustainability funds: a fund whose name implies an ESG focus must hold at least 80% of assets consistent with that focus. The SEC began reviewing the rule’s application to ESG names in 2026, leaving its long-term future uncertain.

    What is the “anti-ESG” backlash, and what did it actually change?

    The 2024-2026 US backlash combined state-level legislation, litigation threats, and political pressure that materially changed institutional behavior even where the underlying risk analysis did not change. The clearest signal was the collapse of the Net-Zero Banking Alliance (NZBA): between December 2024 and January 2025, Goldman Sachs, Wells Fargo, Citigroup, Bank of America, Morgan Stanley, and finally JPMorgan Chase (7 January 2025) all exited, and the alliance subsequently paused operations and moved to restructure into a looser framework body. Major US asset managers similarly stepped back from net-zero investor coalitions such as Climate Action 100+ and the Net Zero Asset Managers initiative, which suspended activities in early 2025. Crucially, most institutions framed these as departures from coalitions and public commitments, not from risk management. Banks continued climate scenario analysis, transition-risk modeling, and sustainable-finance underwriting where commercially driven. The same period saw regulators retreat on mandates: the SEC stopped defending its climate rules in March 2025 and proposed full rescission; the Basel Committee downgraded its bank climate-disclosure framework to voluntary in June 2025 after US pressure, dropping the requirement to disclose financed and facilitated emissions regardless of materiality. The net effect is a bifurcated world: a tighter, ISSB-anchored disclosure regime maturing across the UK, EU, and Asia-Pacific, and a deregulatory, depoliticized posture in the United States.

    Frequently asked questions

    Is ESG investing legally required for US banks?

    No. There is no US federal mandate requiring banks or asset managers to “do ESG.” US disclosure of climate risk via the SEC’s 2024 rules was stayed and is being rescinded. ESG-relevant obligations for US firms now flow mainly from fiduciary duty, the Names Rule for fund branding, and exposure to EU rules when operating in Europe.

    What replaced the TCFD framework?

    The ISSB’s IFRS S2 absorbed and superseded the TCFD recommendations. The Task Force on Climate-related Financial Disclosures was disbanded in 2023, and the IFRS Foundation took over monitoring climate-related disclosure progress in 2024. National rules built on TCFD are migrating to the IFRS S1/S2 baseline.

    Did banks abandon climate risk management when they left the NZBA?

    Generally no. Leaving the Net-Zero Banking Alliance removed a public coalition commitment but did not switch off internal climate-risk analysis, scenario testing, or sustainable-finance lending, which banks largely retained as commercial and prudential disciplines.

    What is the difference between a green bond and a sustainability-linked bond?

    A green bond ring-fences proceeds for specific eligible green projects, so its “greenness” is in how the money is spent. A sustainability-linked bond can fund anything, but its coupon adjusts based on whether the issuer meets predefined sustainability targets, so its integrity depends entirely on how ambitious those targets are.

    Does a fund called “sustainable” have to hold a minimum percentage of sustainable assets?

    Yes, in both major markets. Under ESMA’s EU guidelines, ESG/sustainability-named funds must hold at least 80% of assets aligned with those characteristics and apply benchmark exclusions. Under the SEC Names Rule, an ESG-named US fund must keep at least 80% of assets consistent with the name.

    Is the EU still requiring CSRD reporting after the Omnibus changes?

    Yes, but for far fewer companies. The 2025 Omnibus package raised the mandatory threshold to roughly 1,000 employees and EUR 450 million in net turnover, cutting in-scope entities by an estimated 90% and reducing required ESRS data points by 60-70%. Large EU banks and insurers remain in scope.

    Is the Basel climate-disclosure framework mandatory for banks?

    No. The Basel Committee published its climate-related financial-risk disclosure framework on 13 June 2025 as a voluntary standard outside the Pillar 3 mandatory requirements, leaving adoption to individual national regulators.

    Sources & further reading

    More in Green Finance and About BC ESG.

    Related reading: the lender climate-continuity evidence pack, GRESB scoring levers for property managers, and the Restoration Carbon Protocol. Sister hubs: Restoration Intel, Healthcare Facility Hub, Continuity Hub, Risk Coverage Hub, and Tygart Media.

  • Real Estate ESG Ratings Compared: GRESB, CDP, MSCI, and ENERGY STAR for Commercial Portfolios (2026)

    Real Estate ESG Ratings Compared: GRESB, CDP, MSCI, and ENERGY STAR for Commercial Portfolios (2026)

    Updated Nov 2, 2026 — refreshed commercial real estate rating benchmarks (GRESB, CDP, ENERGY STAR, MSCI), interactive accordion comparison tables, and property management GRESB optimization playbook.

    The five most-cited ESG rating systems — MSCI, Morningstar Sustainalytics, ISS ESG, CDP, and EcoVadis — measure different things, on different scales, in different directions. MSCI grades industry-relative resilience on an AAA–CCC letter scale; Sustainalytics scores absolute unmanaged risk from 0 to 100 where lower is better; ISS ESG flags “Prime” status on an A+ to D- scale; CDP scores environmental disclosure from A to D-; and EcoVadis awards medals to suppliers by percentile rank. Because they define and weight “ESG” so differently, their scores for the same company correlate only about 0.54 on average. This guide explains each methodology, why the numbers disagree, and how to improve every one.
    Instant ESG Ratings Downloads & Improvement Tools

    Master ESG Rating Methodologies, Disagreements & Provider-Specific Uplift

    Field-ready 5-system decoder cards, printable scoring worksheets & improvement checklists, and AI disclosure coaching routines built directly from this guide.

    Field Quick Card FREE

    ESG Ratings Decoder Card

    2-page field reference: The five major rating systems on one card — what each measures, its scale, and which direction is good (MSCI AAA–CCC, Sustainalytics 0–100 lower-is-better, ISS A+ to D-, CDP A to D-, EcoVadis medals) — condensed from the comparison guide.

    Download Free PDF

    Direct download • No email gate

    Working Pack $7

    5-System Quick-Ref & Pack

    Printable/fillable 8-page working pack: 5-system at-a-glance table, scale decoder sheets, Berg et al. divergence one-pager, MSCI GICS key-issue tracker, Sustainalytics exposure vs. managed risk worksheet, ISS Prime checklist, CDP Essential Criteria climber, and EcoVadis medal-blocker log.

    Get Working Pack ($7) →

    Instant checkout • Square verified

    AI Intensive
    Book for Bots $17

    ESG Ratings Navigator Bot Book

    Feed to ChatGPT or Claude: 7 interactive AI audit routines (Rating Picker, Disagreement Decoder, MSCI Focus Audit, Sustainalytics Gap Audit, ISS Prime Line Walkthrough, CDP Climber, EcoVadis Blocker Finder) with embedded output router.

    Get Navigator for Bots ($17) →

    Software made of words • Instant delivery

    ESG ratings at a glance: the five systems compared

    Provider Owned by What it measures Scale & direction Relative or absolute Primary audience
    MSCI ESG Ratings MSCI Inc. Resilience to financially material, industry-specific ESG risks & opportunities AAA → CCC (7 tiers); 0–10 underlying score. Higher is better. Industry-relative (vs. GICS sub-industry peers) Asset managers, index funds
    Morningstar Sustainalytics Morningstar Magnitude of a company’s unmanaged ESG risk 0–100 risk score; 5 bands (Negligible → Severe). Lower is better. Absolute (comparable across industries) Investors, brokerages, risk teams
    ISS ESG Corporate Rating ISS STOXX (Deutsche Börse) Absolute ESG performance vs. demanding best-in-class expectations A+ → D-; “Prime/Not Prime” threshold; decile rank 1–10. Higher is better. Absolute grade + relative decile European institutional investors
    CDP Climate Change CDP (nonprofit) Quality of environmental disclosure and action (climate, water, forests) A/A- → D/D- (+ F for non-response). Higher is better. Absolute (criteria-based) Investors & procurement
    EcoVadis EcoVadis Quality of a supplier’s sustainability management system 0–100 score; Medals by percentile (Bronze → Platinum). Higher is better. Relative (percentile vs. all assessed companies) Procurement / supply-chain teams

    Interactive Provider Deep-Dives (Click to Expand Drill-Downs)

    Readers previously experienced friction clicking static table cells. Click any rating body below to toggle full scoring parameters and methodology thresholds:

    ▸ MSCI ESG Ratings: AAA–CCC Seven-Tier Construct

    MSCI constructs an industry-relative score (0–10) normalized within Global Industry Classification Standard (GICS) sub-industries. Companies are grouped into Leaders (AAA, AA), Average (A, BBB, BB), and Laggards (B, CCC). Scoring evaluates 35 Key Issues weighted from 5% to 30% based on financial impact timelines. Managing an issue deemed financially immaterial to your sector yields zero score movement.

    ▸ Morningstar Sustainalytics: Unmanaged Risk Scale (0–100, Lower is Better)

    Unlike peer-relative raters, Sustainalytics measures absolute unmanaged ESG risk on a 0 to 100 scale across five severity bands: Negligible (0–9.99), Low (10–19.99), Medium (20–29.99), High (30–39.99), and Severe (40+). Calculated as Exposure minus Managed Risk for each Material ESG Issue (MEI). A score of 13.5 reflects Low Risk (highly favorable), not a failing percentile.

    ▸ ISS ESG Corporate Rating: Prime Status Thresholds (A+ to D−)

    ISS ESG applies a 12-point letter grade scale from A+ down to D− alongside a relative 1–10 industry decile rank. European sustainable asset managers primarily screen for binary Prime status (awarded to sector leaders meeting specific environmental and social performance hurdles, typically C+ or B−). Failing Prime exclusion criteria restricts inclusion in Article 8 and 9 SFDR funds regardless of decile standing.

    ▸ CDP Climate Change: Disclosure Gates & Leadership Scoring (A to F)

    CDP evaluates corporate and city disclosure maturity across four sequential tiers: Disclosure (D/D−), Awareness (C/C−), Management (B/B−), and Leadership (A/A−), with ‘F’ assigned for non-response. Progression requires clearing strict Essential Criteria gates; achieving an A-List score mandates verified Scope 1 and Scope 2 emissions data and a validated 1.5°C climate transition plan.

    ▸ EcoVadis: Supply-Chain Sustainability Management (0–100 & Medals)

    EcoVadis rates supplier management systems from 0 to 100 across 21 criteria spanning Environment, Labor & Human Rights, Ethics, and Sustainable Procurement. Medals represent global benchmark percentiles: Platinum (top 1%), Gold (top 5%), Silver (top 15%), and Bronze (top 35%). An essential gating rule: scoring below 30 in any single theme automatically disqualifies a company from receiving any medal.

    The single most important takeaway: a “good” score in one system does not translate to another, because the systems are not measuring the same construct. MSCI asks “is this company managing its material risks better than its peers?” Sustainalytics asks “how much unmanaged risk is left on the table, in absolute terms?” CDP asks “how good is this company’s environmental disclosure?” Comparing a Sustainalytics “Low Risk” to an MSCI “AA” is comparing different questions, not different answers to the same question.

    Why ESG ratings disagree (the research most people miss)

    Credit ratings from Moody’s and S&P correlate at roughly 0.99. ESG ratings do not come close. The landmark study on this is “Aggregate Confusion: The Divergence of ESG Ratings” by Berg, Kölbel & Rigobon, published in the Review of Finance (2022). Examining six major raters, they found:
    • Average correlation of just 0.54 across ESG ratings, ranging from 0.38 to 0.71.
    • Governance ratings are the least correlated, at 0.30 — the dimension investors often assume is most objective is actually where raters disagree most.
    • The social dimension correlates at about 0.42.
    They decompose the disagreement into three sources:
    1. Measurement (56%) — raters measure the same attribute (e.g., “employee turnover”) using different indicators and data, and reach different conclusions.
    2. Scope (38%) — raters include different sets of attributes. One counts lobbying; another doesn’t.
    3. Weight (6%) — raters weight the same attributes differently.
    The study also identified a “rater effect” (a halo): once an agency forms an overall view of a company, that view bleeds into how it scores individual categories. The practical consequence — confirmed in follow-on research — is that ESG rating divergence sends companies mixed signals about which actions the market actually values, and can dampen the incentive to improve. What this means for you: never treat a single ESG score as ground truth. Triangulate across providers, and always ask what the rating measures before you act on it.
    Operational ESG Ratings Toolkit

    Decode Rating Disagreements & Systematically Lift Scores Across All 5 Raters

    When raters correlate at only 0.54, treating any single ESG score as ground truth misallocates capital and corporate effort. Arm your sustainability, finance, and investor relations teams with printable scale decoder sheets, Berg et al. divergence diagnostics (56% measurement / 38% scope / 6% weight), unmanaged risk calculators, and AI coaching routines tailored to the specific scoring mechanics of MSCI, Sustainalytics, ISS, CDP, and EcoVadis.

    ☑

    What’s In The Toolkit:

    • 5-System Master Matrix: Owner, scale, direction, audience.
    • Divergence Breakdown: 56% measurement / 38% scope / 6% weight.
    • MSCI Key Issue Tracker: 5%–30% GICS sub-industry weights.
    • Sustainalytics MEI Worksheet: Exposure − Managed Risk.
    • ISS Prime & Decile Roster: C+ threshold & peer ranks.
    • CDP Essential Criteria: Scope 1/2 verification audit.
    • EcoVadis P-A-R Log: Sub-30 theme cutoff blocker check.
    • AI Bot Book Routines: 7 interactive disclosure audits ($17).
    Secure 1-Click Square Checkout

    MSCI ESG Ratings: industry-relative resilience (AAA–CCC)

    What it measures. MSCI ESG Ratings assess a company’s resilience to financially material, industry-specific ESG risks and opportunities. It is explicitly a financial materiality lens — “which ESG issues could hit the bottom line in this industry, and how well is this company managing them?” The scale. Companies receive a 0–10 underlying score that maps to a seven-tier letter rating:
    • Leader: AAA, AA
    • Average: A, BBB, BB
    • Laggard: B, CCC
    How it works. MSCI identifies the Key Issues that are material for each GICS sub-industry. Each Environmental or Social Key Issue carries a weight of roughly 5% to 30% of the total rating, set according to how much the industry contributes to that issue’s negative externality and how quickly the issue is expected to materialize. Scores are then normalized within each industry, so the rating is fundamentally peer-relative: an AA tells you the company leads its industry on managing material risks, not that it is “sustainable” in an absolute sense. Worth knowing for 2026: MSCI announced a multi-stage ESG Ratings model update (disclosed October 2025) that is transitioning through 2026. If you are benchmarking or citing a specific rating, confirm it against MSCI’s current model rather than an older snapshot. How to improve an MSCI rating: focus only on the Key Issues MSCI deems material for your sub-industry (managing an immaterial issue won’t move the score), strengthen disclosure on those issues, and remember the score is relative — improvement requires outpacing peers, not just improving in absolute terms.

    Morningstar Sustainalytics: absolute unmanaged risk (0–100, lower is better)

    What it measures. The Sustainalytics ESG Risk Rating measures the magnitude of a company’s unmanaged ESG risk — the portion of material ESG exposure that the company has not addressed through programs and policies. Crucially, it runs in the opposite direction from MSCI: a lower score is better. The scale. Scores run 0 to 100 and sort into five risk categories:
    • Negligible: 0–10
    • Low: 10–20
    • Medium: 20–30
    • High: 30–40
    • Severe: 40+
    How it works. For each Material ESG Issue (MEI), Sustainalytics calculates Exposure (how much risk the business is inherently subject to) and then subtracts Managed Risk (the part addressed by the company) — plus a recognized band of risk that is simply unmanageable for that business. Unmanaged Risk = Exposure − Managed Risk. Because exposure is assessed at the sub-industry level but the final score is absolute, Sustainalytics ratings are designed to be comparable across industries and regions — a key difference from MSCI’s peer-relative approach. This is the rating you most often see surfaced on retail brokerages and finance portals. How to improve a Sustainalytics score: close the gap between exposure and management — demonstrate concrete programs, policies, and outcomes on your highest-exposure MEIs. Because the score is absolute, real management improvements move it even if peers don’t change.

    ISS ESG Corporate Rating: “Prime” status (A+ to D-)

    What it measures. Now part of ISS STOXX (Deutsche Börse Group), the ISS ESG Corporate Rating evaluates a company against demanding, absolute best-in-class performance expectations for its industry. The scale. A twelve-grade scale from A+ (best) to D- (worst), with two headline outputs:
    • Prime / Not Prime: companies that clear an industry-specific threshold (often C+, but higher for industries with greater ESG exposure) earn “Prime” status — a signal of ESG investability.
    • Decile rank (1–10): shows relative standing within the industry, where 1 is the strongest and 10 the weakest.
    How it works. ISS ESG combines an absolute letter grade (against a fixed bar) with a relative decile rank (against peers), so you get both “did it meet the standard?” and “how does it rank?” in one rating. As of 2025, ISS defines SMEs as companies with fewer than 500 employees and under USD 500 million in revenue, reflecting expanding mandatory sustainability reporting. How to improve an ISS ESG rating: identify the industry-specific Prime threshold and the absolute criteria behind it, then prioritize the indicators that lift you above the Prime line — the binary Prime status often matters more to investors than incremental grade movement.

    CDP: environmental disclosure, scored A to D-

    What it measures. CDP is different in kind from the others — it is a nonprofit disclosure platform, not a paid third-party rater. Companies respond to CDP’s questionnaire and are scored on the completeness and ambition of their environmental disclosure and action across Climate Change, Forests, and Water Security (with new scoring for cocoa, coffee, and rubber added in 2025). The scale. Four bands, each reflecting a level of progress:
    • A / A- — Leadership (the “A List”)
    • B / B- — Management
    • C / C- — Awareness
    • D / D- — Disclosure
    • F — failure to provide sufficient information / non-response
    How it works. A company must satisfy CDP’s “Essential Criteria” at each level to progress — and as of 2025 those criteria apply at every tier, not just the top. A notable 2025 change: companies must have Scope 1 and Scope 2 emissions externally verified to reach the highest scores, and Forests and Water Security are now publicly scored for the financial-services sector. Because CDP rewards disclosure quality, a high CDP score signals transparency and process maturity — not necessarily low ESG risk. How to improve a CDP score: map your response against the Essential Criteria for the level you’re targeting, secure third-party verification of Scope 1 & 2 emissions early, and treat the questionnaire as a year-round data project rather than an annual scramble.

    EcoVadis: supply-chain medals by percentile

    What it measures. EcoVadis assesses the quality of a company’s sustainability management system — primarily for procurement and supply-chain vetting. It is evidence-based: companies submit documentation, which EcoVadis evaluates through a Policies–Actions–Results (P-A-R) lens. The scale. A 0–100 score across 21 criteria in four themes — Environment; Labor & Human Rights; Ethics; and Sustainable Procurement — translated into medals by percentile:
    • Platinum: top 1% of assessed companies
    • Gold: top 5%
    • Silver: top 15%
    • Bronze: top 35%
    How it works. Medals are awarded relative to all companies assessed in the prior 12 months, so the bar moves with the population. A company is not eligible for any medal if its score in any single theme falls below 30, which prevents one strong theme from masking a weak one. As of January 2025, EcoVadis displays unrounded theme scores (e.g., 68/100) and uses them in the overall calculation. How to improve an EcoVadis medal: close your weakest theme first (the sub-30 cutoff is the most common medal-blocker), and supply concrete evidence for Policies, Actions, and Results — claims without documentation don’t score.

    How to use multiple ESG ratings together

    Because each system answers a different question, the right move is to read them as complementary, not competing:
    • Want financial-materiality and peer benchmarking? Lead with MSCI.
    • Want an absolute, cross-industry risk number? Lead with Sustainalytics.
    • Need a Prime/Not-Prime investability screen (especially in Europe)? Use ISS ESG.
    • Assessing environmental transparency and climate action? Use CDP.
    • Vetting a supplier? Use EcoVadis.
    When two providers disagree sharply on the same company, that’s signal, not noise: it usually means they scope ESG differently (the 38% scope-divergence finding) or weight a controversy differently. Read the underlying sub-scores, not just the headline grade. For a deeper walkthrough of how each scoring methodology is built and provider-specific tactics for lifting a score, see our companion guide to ESG ratings methodology and rating-improvement strategy.
    ESG Ratings Toolkit Overview

    Compare ESG Rating Reference Cards, Working Packs & AI Systems

    Choose the operational tier that matches your disclosure cycle: rapid field summary card, printable working checklists & risk calculation worksheets, or an autonomous AI coach that audits your disclosures and runs provider-specific gap analysis.

    Field Summary

    ESG Ratings Decoder Card

    2-page field reference summarizing the five major rating systems onto a single card.

    • 5 systems on one card: MSCI, Sustainalytics, ISS ESG, CDP, EcoVadis
    • Complete scale & direction guide (clarifying Sustainalytics lower-is-better)
    • Relative vs. absolute construct comparison (avoiding false equivalencies)
    • Target audience mapping (investors, risk officers, lenders, procurement)
    • Direct field download without email gates or registration forms
    FREE
    Download Decoder Card (PDF)

    Instant direct download • No email gate

    Static Working Pack

    5-System Quick-Ref & Pack

    8-page printable & fillable operational toolkit with complete tables, checklists, and trackers.

    • 1-page at-a-glance comparison matrix across all 5 major providers
    • Detailed scale decoders: MSCI tiers, Sustainalytics bands, ISS, CDP, EcoVadis
    • Berg et al. divergence analysis sheet (56% measurement, 38% scope, 6% weight)
    • Provider improvement checklists: MSCI Key Issues, Sustainalytics MEIs
    • ISS Prime threshold tracker, CDP verification box & EcoVadis sub-30 blocker log
    $7.00
    Get Working Pack ($7) →

    Instant checkout • Square verified • Instant delivery

    AI Intensive
    Book for Bots

    ESG Ratings Navigator

    9-page structured AI workbook: feed directly into ChatGPT or Claude to run interactive disclosure audits.

    • Routine 1: Rating Picker Interview (maps use-case to right rater)
    • Routine 2: Disagreement Decoder (56/38/6% divergence & rater halo)
    • Routine 3: MSCI Key-Issue Focus Audit (5%–30% weights & peer peers)
    • Routine 4: Sustainalytics Gap Audit (Exposure − Managed Risk per MEI)
    • Routine 5: ISS Prime Line Walkthrough (A+ to D- & decile 1–10)
    • Routine 6: CDP Essential Criteria Climber (Scope 1/2 verification)
    • Routine 7: EcoVadis Blocker Finder (P-A-R scores & sub-30 cutoff)
    • Embedded Router: Instant switchboard for multi-stakeholder outputs
    $17.00
    Get Navigator for Bots ($17) →

    Software made of words • Instant delivery

    Frequently asked questions

    Which ESG rating is the most accurate?

    None is definitively “most accurate” because they measure different things. MSCI and ISS ESG measure managed performance and resilience; Sustainalytics measures unmanaged risk; CDP measures environmental disclosure; EcoVadis measures supply-chain management systems. “Accuracy” depends on the question you’re asking. The more useful goal is to match the rating to your use case and triangulate across at least two.

    Why does the same company get different ESG scores?

    Because raters disagree on what to measure (scope), how to measure it (measurement), and how to weight it (weight). Research by Berg, Kölbel & Rigobon (2022) found ESG ratings correlate only about 0.54 on average, with measurement differences driving 56% of the divergence. A “rater effect” halo also nudges category scores toward each agency’s overall view of the company.

    Is a low Sustainalytics score good or bad?

    Good. The Sustainalytics ESG Risk Rating runs 0–100 where lower is better — a low score means little unmanaged risk. This is the opposite of MSCI, CDP, ISS ESG, and EcoVadis, where higher is better. Reversing this direction is one of the most common ESG-rating mistakes.

    What does an MSCI rating of A or BBB mean?

    On MSCI’s AAA–CCC scale, both A and BBB fall in the “Average” band — the company is neither a leader (AAA/AA) nor a laggard (B/CCC) at managing the ESG risks material to its industry. Because the rating is industry-relative, the same letter can reflect very different absolute practices across sectors.

    Is CDP an ESG rating?

    Not in the traditional sense. CDP is a nonprofit environmental disclosure platform that scores the quality of a company’s reporting and action on climate, water, and forests (A to D-). It rewards transparency and management maturity rather than scoring overall ESG risk, which is why CDP is best read alongside a true risk or performance rating.

    Does MSCI use CDP data?

    ESG raters draw on many overlapping public sources — corporate filings, CDP disclosures, regulatory data, news and NGO reports — but each applies its own model, indicators, and weights on top. Shared inputs do not produce shared conclusions, which is a core reason ratings still diverge even when raters read the same underlying disclosures.

    What’s the difference between EcoVadis Gold and Platinum?

    Both are percentile awards: Platinum goes to the top 1% of companies assessed by EcoVadis in the prior 12 months, and Gold to the top 5%. Because they’re relative to the assessed population, the score needed for each medal can shift year to year. No medal is awarded if any single theme scores below 30.

    Sources & further reading

    More in ESG Metrics and About BC ESG.

    How to interpret your score (MSCI, Sustainalytics, ISS, CDP, EcoVadis)

    Clicks on this page are interpretation questions, not “what is ESG.” Use this table, then the FAQ.

    ProviderScaleBetter meansWhat a CRE operator should ask
    MSCI ESG RatingsAAA–CCC (industry-relative)Higher letter = more resilient vs peersWhich industry peer set? What is the key-issue overweight?
    Morningstar Sustainalytics0–100 unmanaged risk (lower is better)Lower number = less unmanaged ESG riskCompany-wide or entity score? Which issues drive it?
    ISS ESGA+ to D- / Prime statusPrime = best-in-class vs industryDoes the lender or index actually use ISS, or only MSCI?
    CDPA to D-Disclosure and performance on climate, water, forestsDid we even file? A D often means thin disclosure, not a ruined building.
    EcoVadisMedals by percentileHigher percentile vs scored universeAre tenants or GCs asking for this in procurement?

    FAQ: is 13.5 a good Sustainalytics rating?

    On Sustainalytics’ unmanaged-risk scale, lower is better. 13.5 typically sits in low risk (0–9.99 negligible, 10–19.99 low, 20–29.99 medium, 30–39.99 high, 40+ severe — confirm against the current methodology page). A 13.5 is not a trophy and not an emergency. Ask which issues make up the 13.5, and whether they are material to this portfolio (energy, physical climate, vendor labor) or to a corporate parent in another sector.

    Is Sustainalytics more credible than MSCI?

    Neither is the official score of record. They answer different questions. MSCI is industry-relative financial materiality. Sustainalytics is absolute unmanaged risk. Disagreement is normal. For a CRE board: report both, plus the issue drivers, rather than arguing which vendor is truer.

    Why do MSCI, Sustainalytics, S&P, CDP, and EcoVadis disagree?

    Different universes, different issue weights, different use of company disclosure vs controversies, and different treatment of subsidiaries. A REIT can look strong on GRESB and average on MSCI if the parent’s corporate controversies dominate. That is a mapping problem, not a morality play.

    What should we do this quarter if ratings disagree?

    1. Map which counterparties use which score (banks, insurers, indices, GCs).
    2. Fix the shared evidence file those counterparties can reuse (energy, emissions method, governance, vendor diligence) instead of optimizing one vendor’s questionnaire.
    3. Link the evidence pack to ISSB/GRI headings so the same file feeds disclosure — see the templates and ISSB checklist.

    Do we need a better rating or a better building?

    Lenders and large tenants increasingly want operational evidence (EUI, filings, physical-risk notes, continuity tests), not a letter-grade chase. Use ratings to find the gap. Use CRE ESG programs and the climate-risk guide to close it.

    FAQ pack added August 22, 2026 from Bing click queries on this URL. Do not treat a single vendor score as a compliance outcome.

    Related reading: mid-market ESG disclosure templates, the IFRS S1/S2 disclosure checklist, and the Restoration Carbon Protocol. Sister hubs: Restoration Intel, Healthcare Facility Hub, Continuity Hub, Risk Coverage Hub, and Tygart Media.

    Commercial Real Estate Rating Benchmark Matrix (2026–2027)

    While public-equity ESG ratings evaluate broad corporate governance, commercial real estate asset directors and REIT managers operate under rating frameworks governed by asset-level metering, verified utility data, and building performance standards. The table below details the benchmark systems that dictate real estate valuations, green debt spreads, and institutional equity allocations:

    Rating System Governing Body & Scope Scoring Scale & Thresholds Institutional Capital Impact
    GRESB Real Estate Assessment GRESB B.V.
    Standing Investments & Development portfolios (Energy, GHG, Water, Waste).
    0–100 Score (Management 30 pts, Performance 70 pts) plus 1 to 5 Stars (quintile rank vs. global peer group). Dictates institutional LP allocations; directly moves margin pricing on sustainability-linked credit facilities. Key tactics detailed in GRESB Scoring Levers for Property Managers.
    CDP Climate Change (Real Estate) CDP Global.
    Scope 1, 2, and 3 downstream leased assets, transition plans, and board oversight.
    A through F (A/A- Leadership, B/B- Management, C/C- Awareness, D/D- Disclosure, F Non-response). Enterprise tenant procurement requirement; aligns portfolio greenhouse gas boundaries with our Carbon Accounting Scope 1-3 Guide.
    ENERGY STAR Portfolio Manager U.S. EPA.
    Normalized operational Energy Use Intensity (weather, occupancy, operating hours).
    1–100 Percentile Score.
    Score of 75+ earns certified ENERGY STAR building label.
    Statutory basis for municipal compliance, including NYC Local Law 33 entrance letter grades under the NYC Building Compliance Stack; prerequisite for green financing.
    MSCI Real Estate ESG Index MSCI Inc.
    Corporate governance, transition risk, and green building revenue shares for listed REITs.
    AAA to CCC.
    Relative to global real estate equity peers.
    Determines listed-REIT inclusion in major global sustainability ETFs and institutional active equity mandates, protecting against transition risk and asset stranding.

    GRESB Score Optimization Playbook for Property Managers

    For property managers and facility directors, capturing points in the annual GRESB Real Estate Assessment requires systematic operational discipline rather than questionnaire marketing. Property managers should concentrate operational CapEx and staff time across three high-impact scoring levers:

    1. Automated Utility Data Coverage (Eliminating Estimates): Under GRESB scoring rules, estimated utility data is discounted heavily relative to verified whole-building meter data. Transitioning tenant and base-building utility collection from manual bill entry to automated Electronic Data Interchange (EDI) feeds directly increases data coverage percentages and verification points in the Performance Component. Establishing verified utility feeds is also essential for supplier vetting outlined in our Property Management Vendor ESG Checklist.
    2. Operational Building Certifications for Covered Floor Area: Points in the Building Certifications indicator require full-floor area coverage under accredited operational schemes: LEED for Operations and Maintenance (O+M), BREEAM In-Use, or Fitwel. Asset managers should prioritize recertification schedules for properties approaching expiration to prevent sudden multi-point scoring drops during annual submission windows.
    3. Green Leases and Tenant Data-Sharing Covenants: Triple-net leased assets historically suffer from low GRESB data coverage because landlords cannot compel tenant utility disclosure. Incorporating mandatory green lease riders with automated tenant interval data sharing and submetering requirements eliminates Scope 3 Category 13 data voids and unlocks maximum tenant engagement points.

    Notice on ESG Ratings & Benchmarking: This analysis is published for commercial real estate developers, REIT asset managers, and corporate sustainability officers for strategic planning. Scoring methodologies reflect published criteria by GRESB B.V., CDP Global, MSCI Inc., and the U.S. EPA. This guide does not represent formal rating submission verification, securities underwriting, or certified rating advisory. Organizations should review current annual assessment protocols with their respective rating bodies and sustainability assurance providers.

  • Business Continuity Planning for Property Management Firms: The NYC Building Playbook

    Business Continuity Planning for Property Management Firms: The NYC Building Playbook

    Updated October 6, 2026.

    If you run business continuity for a property management firm, this guide ties FDNY life-safety plans, portfolio coordination, and post-loss documentation to LL97 disaster-mitigation evidence.

    A business continuity plan for a property management firm has to answer three questions most corporate BCP templates never ask: can the building legally operate the morning after the event, can the management firm keep serving its whole portfolio while one property is in crisis, and does the recovery generate the documentation that regulators and reporting frameworks will ask for later? In New York City, those questions have specific legal anchors — FDNY’s combined fire safety and emergency action plan requirements, the city’s Business Preparedness and Resiliency Program, and (the one nobody connects) Local Law 97’s disaster-mitigation provision, which can turn a well-documented loss into a zero-dollar penalty year.

    What makes property management continuity different

    A corporate occupier plans for one organization in leased space. A PM firm plans for a portfolio: the event at 425 Whatever Street is also a staffing, communication, and vendor-allocation problem for every other building the same team serves. The plan therefore has two layers:
    • The building layer — life safety, systems recovery, tenant communication, and regulatory continuity for each property.
    • The firm layer — who backstops the affected property team, how vendor capacity is allocated when two buildings flood in the same storm, and how the firm communicates to owners and tenants portfolio-wide.

    The NYC legal floor (cite these, your insurers do)

    • FDNY 3 RCNY §06-02 — office buildings must maintain a combined Fire Safety and Emergency Action Plan (EAP), accepted by FDNY; buildings with an occupancy over 100 require an EAP Director holding the FDNY Certificate of Fitness; fire drills run semi-annually and EAP drills annually. This is the legally required core your BCP extends — not a separate document.
    • NYC Fire Code Chapter 4 — the emergency planning and preparedness baseline for the occupancy types in your portfolio.
    • NYC Business Preparedness and Resiliency Program (BPRP) — the city’s free continuity planning resources for businesses, useful as the tenant-facing layer of your plan.

    The plan, in seven components

    1. Life safety and the legal documents — current FDNY-accepted plans, named EAP Director and deputies, drill records. Everything else assumes this layer is real.
    2. Systems and dependencies map — per building: power, steam/gas, elevators, BMS, telecom, and the single points of failure (the one transformer vault, the one riser). The LL87 energy audit you already paid for contains half of this map; reuse it.
    3. Vendor pre-positioning — signed MSAs with restoration, mechanical, electrical, and environmental vendors before the loss, with rate schedules and response-time commitments. Procurement during a crisis through an insurance TPA is how buildings end up with whoever was available. This is also where the emissions-data clause belongs — one sentence added now, because post-event is too late.
    4. Communication tree — owner, tenants, insurers, FDNY/DOB, utility, and the firm’s other properties. Pre-drafted tenant notices for the five most likely events (water, fire, power, elevator, weather closure) save the worst hour of the worst day.
    5. Data continuity — the building’s compliance records (ESPM access, BEAM filings, drill logs, equipment inventories) survive the event if they live in the firm layer, not in a flooded management office. The portfolio that can produce its records recovers its operations — and its insurance claim — faster.
    6. The documentation reflex — from hour one: photographs, equipment logs, timelines. This is simultaneously your insurance claim, your LL97 penalty-zero evidence (1 RCNY 103-14(i)(1): documented hurricane, flooding, or fire damage “may result in a penalty of zero dollars” for the year), and — if your vendors report under CRCP — the carbon record your owner’s GRESB submission and your tenants’ Scope 3 inventories will ask for.
    7. The after-action loop — every event updates the plan, the vendor scorecards, and the dependency map. Continuity planning is calibration, not a binder.

    The part other BCP guides miss: recovery is a reporting event

    A major loss at a covered NYC building triggers a paperwork cascade that begins after the water is out: the insurance claim, the LL97 filing for a distorted emissions year (emissions during declared emergencies are excluded by statute; disaster damage is a named penalty-mitigation factor), the benchmarking anomaly you will explain in next year’s LL84 data, and — increasingly — the ESG questions from owners and corporate tenants about what the recovery itself emitted. A continuity plan that treats documentation as a recovery deliverable, not an afterthought, converts the worst week of the building’s year into the best-evidenced file in the portfolio. That is the practical meaning of resilience for a management firm: the building reopens, the penalties zero out, and the data survives.

    What this means for each seat at the table

    If you are the… Continuity means…
    Owner Asset protection plus penalty protection: the documented loss is the difference between an LL97 penalty year and a zero-dollar one, and pre-positioned vendors beat crisis pricing every time.
    Facility / property manager You run both layers — the building’s legal floor (FDNY plans, drills, the EAP Director’s certificate) and the firm’s portfolio response. The vendor MSAs and the documentation reflex are yours to build this quarter, not during the event.
    Tenant Your own continuity plan should reference the building’s: evacuation roles, restoration priority for your space, and — if you report under SB 253 or CSRD — how recovery work in your suite gets carbon-documented.

    Frequently asked questions

    What should a business continuity plan for a property management firm include?

    Seven components: the FDNY-required life-safety plans, a building systems and dependency map, pre-positioned vendor agreements, a communication tree with pre-drafted tenant notices, firm-level data continuity for compliance records, a documentation protocol that starts at hour one, and an after-action update loop.

    What emergency plans are legally required in NYC office buildings?

    A combined Fire Safety and Emergency Action Plan accepted by FDNY under 3 RCNY §06-02, an EAP Director with the FDNY Certificate of Fitness where occupancy exceeds 100, semi-annual fire drills, and annual EAP drills — the mandatory core a business continuity plan builds on.

    How does business continuity connect to Local Law 97?

    Two ways: emissions during declared emergencies are excluded from a building’s LL97 calculation, and documented disaster damage (hurricane, severe flooding, fire — with photographs) can reduce the year’s penalty to zero under 1 RCNY 103-14(i)(1). The documentation your recovery generates is compliance evidence.

    Why pre-position restoration vendors before a loss?

    Crisis procurement through an insurance TPA optimizes for availability, not fit. Pre-signed MSAs lock rates, response times, documentation standards — and the emissions-data clause that makes the vendor’s job file feed your ESG reporting, which cannot be added retroactively.

    Who in a property management firm should own the continuity plan?

    The building layer belongs to each property’s manager with the EAP Director; the firm layer — portfolio staffing, vendor allocation, owner communication — belongs to a named senior operations owner. Plans without a named owner are shelf documents.

    Primary sources

    More in NYC Business Continuity and About BC ESG.

    Related reading: the disaster recovery plan framework, hotel and hospitality BCP, and the Restoration Carbon Protocol. Sister hubs: Restoration Intel, Healthcare Facility Hub, Continuity Hub, Risk Coverage Hub, and Tygart Media.

  • The Property Management Vendor ESG Due Diligence Checklist (2026)

    The Property Management Vendor ESG Due Diligence Checklist (2026)

    Last updated: June 10, 2026. By Will Tygart, author of the Commercial Restoration Carbon Protocol (CRCP). The full checklist is on this page in plain HTML — no gate, no form. Vendor due diligence in property management has always meant three folders: license, insurance, references. ESG adds a fourth — and for most building vendors it comes down to twelve questions across environmental data capability, waste handling, labor practice, and governance basics. This checklist is built for the vendors a building actually hires — restoration crews, mechanical contractors, roofers, haulers, cleaners — not for the Fortune 500 supplier surveys that ask a 30-person contractor for a corporate sustainability report it will never have. The fourth folder — vendor ESG — is not a consultant invention. Facility managers are already sitting in that conversation through public chapter work, and restorers who cannot answer a Scope 3 question are not ready for that table. Why this is landing on property managers now: large enterprises are pushing their Scope 3 obligations down the chain. California’s SB 253 puts purchased goods/services and waste in the first Scope 3 reporting wave (2027); CSRD already reaches the value chains of European-exposed companies; and GRESB scores real estate entities on whether they “monitor external suppliers’ compliance with ESG-specific requirements” (GRESB Reference Guide). For a smaller vendor, inability to answer basic ESG questions is starting to mean lost contracts — which makes this checklist as useful to send your vendors in advance as it is to score them with.

    The checklist

    Part 1 — Environmental (the part with dollar consequences)

    # Question What good looks like
    E1 Can you provide job-level emissions activity data (equipment runtime, fuel, mileage, materials) in a standard format? Yes, per-job — the CRCP twelve-field record or equivalent. “We can send our sustainability brochure” is a no.
    E2 How do you document waste streams and disposal? Manifests retained, receiving facilities named, diversion/recycling rates known for typical jobs.
    E3 What is your fleet and equipment profile? Vehicle list with fuel types; any electric equipment; generator policy (when grid power is available, do crews use it?).
    E4 What chemicals do you bring into occupied buildings? SDS sheets on request, low-VOC defaults, antimicrobial protocols that respect indoor air in occupied space.
    E5 Have you accepted contractual emissions-data clauses before? Yes, or willing — the MSA line: “per-job emissions data in the requesting organization’s specified format as a condition of final invoice approval.”

    Part 2 — Social (the part your tenants ask about)

    # Question What good looks like
    S1 Workforce: employees or 1099 crews? Training and certifications current? Stable crews, named certs (IICRC for restoration, EPA 608 for mechanical, OSHA 30 supervision).
    S2 Prevailing wage / labor compliance where applicable? Clean record; no open wage cases. (NYC work makes this a practical, not theoretical, screen.)
    S3 Site conduct in occupied buildings: background checks, badging, tenant-interaction policy? A written policy, not an assurance.

    Part 3 — Governance (the part that predicts the other two)

    # Question What good looks like
    G1 Who owns ESG/compliance questions at the firm? A named person who answers within a business day — ownership is the whole test.
    G2 Documentation discipline: can you produce last year’s job files? Fast retrieval. A vendor who can find the file can fill the carbon template; insurance-trained contractors usually can.
    G3 Data handling: how is our building’s information stored and shared? Basic answer covering job photos, access records, and any cloud platforms used.
    G4 Subcontracting: do these standards flow down? Yes, contractually — otherwise every answer above only covers the top layer.

    How to score it without building a bureaucracy

    Three tiers, not a spreadsheet of weights: Ready (answers E1/E2/G2 affirmatively with evidence — these are your strategic vendors and your CRCP early adopters); Willing (gaps, but accepts the MSA clause and the template — most good trade vendors live here in 2026; give them a cycle to mature); Resistant (will not commit to documentation — a flag that predicts problems well beyond carbon). The honest framing for vendors: none of this is legally required of them today, and you should say so. It is contractually required by you, because GRESB, SB 253-covered tenants, and investor questionnaires are asking you — and the vendors who can answer become the ones you can put in front of any client.

    Apply the 80/20 before applying the checklist

    CDP’s supplier data shows roughly 20% of suppliers drive about 80% of supply-chain emissions — and fewer than half of data requests get answered at all. Run the full checklist on the carbon-heavy minority — restoration, demolition, roofing, mechanical replacement, hauling — and only Parts 2–3 on the long tail. Your window washer does not need a fleet profile; your restoration vendor absolutely does, because a single large water loss can out-emit a year of routine maintenance (the only published figure in the field: restoring one flooded home ≈ 6.5 return transatlantic flights of CO2, per Aviva — commercial losses run larger). For how this same data feeds business continuity planning, see Restoration Contractors and Scope 3 on Continuity Hub; for the insurance-claims side, see this Risk Coverage Hub piece.

    What this means for each seat at the table

    If you are the… The checklist is…
    Owner Your GRESB supplier-monitoring evidence, generated as a byproduct of procurement you already do.
    Facility / property manager A one-page addition to vendor onboarding that future-proofs every contract you sign this year — send it before the RFP, not after the award.
    Tenant (corporate occupier) Proof your landlord’s vendor pool can feed your Scope 3 inventory — worth one question in your next lease negotiation.

    Frequently asked questions

    What should a vendor ESG questionnaire ask?

    Twelve questions across three parts: environmental data capability (job-level emissions data, waste documentation, fleet, chemicals, contract clauses), social practice (workforce, wage compliance, site conduct), and governance (a named owner, document retrieval, data handling, subcontractor flow-down). Skip corporate-footprint questions small vendors cannot answer.

    Is ESG vendor due diligence legally required for property managers?

    No law requires it today. The drivers are GRESB’s scored supplier-monitoring indicator, SB 253-covered tenants whose 2027 Scope 3 reporting includes purchased services and waste, and investor questionnaires — contractual and commercial pressure, not statute.

    How is this different from a normal vendor compliance checklist?

    Standard checklists cover licenses, insurance, and references. This adds the ESG layer that those never touch — specifically the job-level carbon data capability that generic corporate supplier surveys ask for in a form building trades cannot answer.

    Which vendors should get the full checklist?

    The carbon-heavy 20%: restoration, demolition, roofing, mechanical replacement, and hauling. Routine low-impact services need only the social and governance parts.

    What if a vendor fails the environmental section?

    Distinguish willing from resistant. A vendor with gaps who accepts the data clause and template is normal in 2026 — give them a cycle. A vendor who refuses documentation commitments is telling you something about every future claim file too.

    Sources

    More in ESG Vendor Management and About BC ESG.

    Related reading: Commercial Restoration Carbon Protocol, GRESB scoring levers, and mid-market disclosure templates. Sister hubs: Restoration Intel, Healthcare Facility Hub, Continuity Hub, Risk Coverage Hub, and Tygart Media.

  • NYC LL84, LL88, LL87 & LL33 Compliance Stack: Unified Calendar & Deadlines (2026)

    NYC LL84, LL88, LL87 & LL33 Compliance Stack: Unified Calendar & Deadlines (2026)

    Updated: November 14, 2026 — Refreshed to reflect current statutory cycles, verification rules, and post-election regulatory posture.

    Short answer: New York City property managers do not face four isolated rules — Local Laws 84/133 (Benchmarking), LL87 (10-year Audits & RCx), LL88 (Lighting & Submetering), and LL33/95 (Energy Letter Grades) operate as an interconnected compliance data stack administered by the NYC Department of Buildings (DOB). Most critically, timely LL84 submissions and LL88 attestations act as legal gatekeepers for mitigated penalties under NYC Local Law 97.

    Separating them creates recurring surprises: quarterly late fines on May 1 LL84 benchmarking automatically sabotage October LL33/95 building grades (triggering a public ‘F’ grade for unsubmitted properties and a $1,250 fine), while overlooking a tax-block-digit December 31 LL87 audit due date blocks access to DOB decarbonization relief. See also our dedicated LL84 Prerequisite Technical Walkthrough.

    Statutory Status at a Glance
    • LL84 / LL133 Benchmarking (May 1 Annual): Whole-building electricity, gas, fuel oil, steam, and water consumption for >=25,000 sq ft properties via ENERGY STAR Portfolio Manager; quarterly non-filing fines ($500/qtr up to $2,000/yr).
    • LL33 / LL95 Energy Letter Grades (Oct 1–31 Annual): Owners download DOB NOW Energy Efficiency Labels starting October 1 and display A–D/N/F grades at every public entrance within 30 days ($1,250 penalty).
    • LL88 Lighting & Submetering (Active Jan 1, 2025+): Mandates NYC Energy Conservation Code-compliant lighting across non-residential buildings >25,000 sq ft and residential common areas, plus electrical submeters for non-residential tenant spaces >5,000 sq ft.
    • LL87 Audits & Retro-Commissioning (Dec 31 10-Yr Rotation): Buildings >50,000 sq ft submit Energy Efficiency Reports (EER) by December 31 in the year matching the final digit of their NYC Tax Block number (e.g., Block ending in 6 -> Dec 31, 2026).
    Print-First Compliance Brief

    Download the NYC Four-Law Building Compliance Calendar

    2-page Print-First PDF syncing LL84 benchmarking, LL33/95 grade posting, LL88 submetering/LEDs, and LL87 10-year EER audits into one annual calendar.

    Why Benchmarking, Lighting & Audit Filings Gate LL97 Penalty Relief

    Even though DOB administers separate violation numbers for LL84 ($500 quarterly benchmarking fine), LL88 ($1,500 initial + monthly non-submetering penalties), and LL87 ($3,000 initial + $5,000/yr late EER fines), their operational interconnection is tight. DOB’s Good-Faith Effort criteria under 1 RCNY § 103-14(i)(2) explicitly verify that an owner submitted timely LL84 benchmarking data and valid LL88 attestations before granting mitigated LL97 penalties.

    Meanwhile, LL84 utility feeds populate both your LL33 lobby letter grade and the exact meter inventory imported by your Registered Design Professional for annual LL97 emissions filings — meaning meter omissions fixed once in Portfolio Manager protect four filings simultaneously.

    • Con Edison & National Grid Aggregation: Request automated whole-building utility uploads at least 45 days before May 1 to prevent estimated billing gaps that trigger DOB data flags.
    • Tenant Submeter Exception Check (LL88): Non-residential leases executed strictly below 5,000 sq ft on single-tenant floors remain exempt from individual submetering unless aggregated on the same floor above 5,000 sq ft.
    • LL33 Score Cutoffs: Grade A (>=85 ENERGY STAR), B (70–84), C (55–69), D (1–54), N (exempt/unscorable property types), F (failed to submit LL84 benchmarking).
    Local Law & CitationThreshold & CoverageDeadline / CadenceStatutory Violation Exposure
    LL84 / LL133 (§ 28-309)Single bldgs >=25k sf; multi-bldg tax lots >=100k sfAnnual May 1 (ENERGY STAR PM)$500/quarter ($2,000/yr cap) + triggers F grade
    LL33 / LL95 (§ 28-309.12)Covered LL84 buildings >=25k sfDownload Oct 1; post by Oct 31$1,250 annual non-posting DOB fine
    LL88 (§§ 28-310, 28-311)Nonres >25k sf lighting; tenant spaces >5k sf submetersCompliance active Jan 1, 2025+$1,500 initial + per-submeter fines + blocks LL97 relief
    LL87 (§ 28-308)Buildings >50k sf (or multi-bldg lots >100k sf)Dec 31 on 10-yr Tax Block last digit$3,000 year 1; $5,000 each subsequent yr late
    Calendar diagram linking NYC Local Law 84 benchmarking (May 1), Local Law 33/95 energy letter grades (Oct 31), Local Law 88 lighting/submetering attestations, and Local Law 87 10-year audit/RCx rotations.
    How NYC DOB integrates LL84/133 benchmarking, LL33/95 letter grades, LL88 lighting/submetering, and LL87 10-year audits into a prerequisite stack for LL97 mitigation.

    Sequencing One 12-Month NYC Building Compliance Calendar

    Rather than scrambling around four disconnected dates, commercial and multifamily asset teams should align accounting and engineering reviews into four quarterly gates covering utility verification, May 1 Portfolio Manager uploads, October lobby label posting, and December 31 LL87 rotation checks.

    • Q1 (Jan–Mar): Verify ConEd/National Grid whole-building feeds and check whether the NYC Tax Block final digit triggers a December 31 LL87 Energy Efficiency Report.
    • Q2 (May 1): Submit annual LL84/133 Portfolio Manager benchmarking + LL97/LL88 attestations in DOB NOW.
    • Q4 (Oct 1–31 & Dec 31): Download and post LL33 letter grades at all entrances by October 31; file due-year LL87 EERs by December 31 ($3,000–$5,000 avoided).

    Compliance Execution Checklist

    StepOwner / TeamAuditable Deliverable
    1. Utility Meter AuditProperty ManagerReconcile ConEd/National Grid whole-building CSV accounts in Portfolio Manager.
    2. May 1 Joint WindowCompliance / RDPFile LL84 benchmarking alongside LL88 and LL97 filings before May 1.
    3. Oct 31 Lobby GradeBuilding OperationsPrint DOB NOW Energy Efficiency Label and post in public lobby + photo proof.
    4. Block-Digit LL87 CheckEngineering LeadVerify NYC Tax Block final digit against upcoming Dec 31 EER audit cohort.
    Field & Print Package

    Keep This New York City, NY Compliance Checklist Handy

    Download the formatted 2-page PDF reference brief or pull the structured Markdown edition for internal compliance documentation.

    Frequently Asked Questions

    Which NYC buildings owe LL84 benchmarking vs. LL87 energy audits?

    LL84/133 benchmarking applies annually starting at >=25,000 sq ft, whereas LL87 10-year Energy Efficiency Reports (audits and retro-commissioning) apply at >50,000 sq ft (or multi-building lots >100,000 sq ft) on a Tax Block last-digit schedule.

    What happens if I miss LL84 benchmarking before October LL33 grade issuance?

    NYC DOB issues an automatic 'F' Energy Efficiency Grade in October, triggers $500 quarterly benchmarking fines, and renders your building ineligible for 1 RCNY § 103-14(i)(2) LL97 penalty mitigation.

    How is my Local Law 87 due date determined?

    Your 10-year LL87 EER deadline falls on December 31 of the calendar year whose last digit matches the final digit of your NYC Tax Block number (e.g., Tax Block 1206 is due December 31, 2026).

    Primary Authorities & Official Resources

    Informational notice: This guide summarizes enacted statutes, regulations, or pending legislative records from the primary authorities linked above as of November 14, 2026. It is not legal, accounting, or licensed engineering advice.

  • Local Law 97 Fines: The $268-Per-Ton Math and a Calculator Built From the Rule Itself (2026)

    Local Law 97 Fines: The $268-Per-Ton Math and a Calculator Built From the Rule Itself (2026)

    Updated October 6, 2026.

    Use the calculator below for $268-per-ton LL97 excess-emissions math from 1 RCNY 103-14; confirm penalties and filing status in DOB records — this page does not state outcomes for your building.

    A Local Law 97 fine is calculated in one line: (your building’s actual annual emissions − its emissions limit) × $268 per metric ton of CO2e, assessed every year you remain over the cap. The limit is your gross floor area times a published factor for your property type — 0.00758 tCO2e per square foot for an office today, falling to 0.002690852 in 2030. The separate failure-to-file penalty is gross floor area × $0.50 per month. Use the calculator below for your building, then read the part nobody’s calculator shows you: what the 2030 factors do to a building that is comfortably compliant today.

    LL97 Penalty Calculator — emissions factors as printed in 1 RCNY 103-14(c)(3); penalty rate $268/tCO2e per Admin Code §28-320.6.

    Estimates only. Mixed-use buildings use square-footage-weighted factors; for 2024–2025 owners could elect the statutory occupancy-group limits instead; good-faith-efforts mitigation, RECs, AHRF offsets, and the disaster provision can reduce penalties. Always confirm against 1 RCNY 103-14 and your Registered Design Professional.

    The formula, worked by hand

    Take a 60,000 sq ft Midtown office building:
    • Limit today: 60,000 × 0.00758 = 454.8 tCO2e/year
    • If it emits 550 tCO2e: (550 − 454.8) × $268 = $25,514/year
    • If it never files: 60,000 × $0.50 = $30,000/month — one month of silence costs more than a year of being 21% over the cap. Whatever else is true about your building, file.

    The 2030 cliff, in numbers nobody publishes

    Most LL97 coverage says the 2030 limits get “roughly 40% stricter.” The actual factors in the rule (1 RCNY 103-14(c)(3)(iii)) are far more dramatic for some property types:
    ESPM property type 2024–2029 factor 2030–2034 factor Reduction
    Office 0.00758 0.002690852 −65%
    Multifamily Housing 0.00675 0.003346640 −50%
    Hotel 0.00987 0.003850668 −61%
    Retail Store 0.00758 0.002104490 −72%
    Non-Refrigerated Warehouse 0.00426 0.000883187 −79%
    Hospital 0.02381 0.007335204 −69%
    Data Center 0.02381 0.014791131 −38%
    Restaurant 0.01181 0.004038374 −66%
    K-12 School 0.00675 0.002230588 −67%
    Medical Office 0.01074 0.002912778 −73%
    (Factors are tCO2e per square foot per year, as printed in the rule. The 2030 table also cuts the grid-electricity coefficient roughly in half — to 0.000145 tCO2e/kWh — reflecting expected grid cleanup, which softens the blow for electrified buildings specifically.) What that does to a real building: the same 60,000 sq ft office emitting 400 tCO2e is comfortably under its 454.8-ton cap today — penalty $0. In 2030 its cap drops to 161.5 tons. Same building, same energy use: 238.5 tons over, $63,931 per year, every year. That is why Urban Green’s finding — only ~9% of properties exceed today’s caps but ~57% exceed the 2030 caps — is the single most important number in NYC real estate planning, and why a “we’re compliant” answer in 2026 is only half an answer.

    The fines-versus-retrofit math, honestly

    Some owners are paying. Habitat’s reporting quotes a senior official at a prominent real estate firm: eliminating the fines would mean investing “15 to 20 times the fine amount,” and an energy manager’s example pits an $8–10M retrofit against a ~$180,000-a-year penalty (Habitat, March 2025). For 2026, that arithmetic can be rational. It stops being rational on three clocks. First, fines repeat annually, forever — a $180K/year penalty is $1.8M over a decade against a one-time retrofit. Second, the 2030 factors multiply the overage: the building paying $180K today may be paying three to five times that from 2030. Third, equipment dies on its own schedule anyway — the cheapest compliance is the boiler you were already replacing, replaced electric, with beneficial-electrification credits that are richest before December 2026. REBNY projects citywide fines approaching $900 million a year once the 2030 limits bite — the buildings that avoid contributing to that number are the ones doing the math now, while the retrofit can ride the capital calendar instead of fighting it.

    Five things that legitimately reduce an LL97 penalty

    1. Good-faith-efforts mitigation (1 RCNY 103-14(i)(2)) — requires a filed report, current LL84 benchmarking, and LL88 attestation, plus a qualifying path such as an RDP-certified decarbonization plan or an approved application for compliance work.
    2. RECs — offset electricity-attributable emissions only, must be NYC-deliverable, currently uncapped (decarbonization-plan filers excluded); Zone J Tier 4 supply (CHPE, Clean Path NY) becomes materially available during 2026.
    3. AHRF offsets — capped at 10% of your limit, priced at $268/ton (deliberately equal to the penalty), funding affordable-housing decarbonization.
    4. The disaster provision (1 RCNY 103-14(i)(1)) — documented hurricane, severe flooding, or fire damage that precluded compliance can zero the year’s penalty. Your restoration contractor’s job file is the evidence; see what LL97 does and does not count.
    5. Mediated resolution — a negotiated DOB compliance plan in lieu of penalty, case by case.

    What this means for each seat at the table

    If you are the… The penalty math says…
    Owner Run the calculator twice — today’s factor and 2030’s. The second number belongs in the capital plan and the next refinancing conversation, because lenders are already running it.
    Facility / property manager Your energy data is the input to a six-figure equation. Tight ESPM records, submetering, and vendor documentation are what make the difference between an estimated overage and a defended one.
    Tenant Your consumption is inside the building’s number, and lease structures increasingly pass LL97 exposure through. A tenant who can demonstrate efficiency is negotiating leverage; one who cannot is a cost center.

    Frequently asked questions

    How are Local Law 97 fines calculated?

    (Actual annual building emissions − the building’s emissions limit) × $268 per metric ton CO2e, assessed annually. The limit is gross floor area × the published factor for your ESPM property type — 0.00758 tCO2e/sqft for offices in 2024–2029, dropping to 0.002690852 in 2030.

    How much is the LL97 penalty per ton?

    $268 per metric ton of CO2e over the limit, per year. The Affordable Housing Reinvestment Fund offset is deliberately priced at the same $268 — the city set the escape hatch at exactly the cost of the penalty.

    What is the penalty for not filing an LL97 report?

    Gross floor area × $0.50 per month, retroactive to May 1 of the filing year. On a 60,000 sq ft building that is $30,000 a month — typically far worse than the overage penalty itself.

    When do LL97 fines start?

    They already have: caps took effect January 1, 2024, first reports were due in 2025, and DOB confirmed in April 2026 that ~1,400 non-filers are in the enforcement pipeline with OATH cases in preparation. The much larger fine wave arrives with the 2030 limits, which roughly 57% of covered buildings currently exceed.

    How much stricter do LL97 limits get in 2030?

    It depends on property type: offices drop 65%, retail 72%, warehouses 79%, multifamily 50%, data centers 38% — per the factors printed in 1 RCNY 103-14(c)(3)(iii). A building comfortably compliant today can face a six-figure annual penalty in 2030 at the same energy use.

    Is there an official LL97 penalty calculator?

    DOB publishes the factors and formula but no official calculator; NYC Accelerator’s Building Energy Snapshot is the closest city tool. The calculator on this page applies the rule’s printed factors directly and shows both compliance periods side by side.

    Primary sources

    More in Local Law 97 and About BC ESG.

    Related reading: non-filing penalty estimator, Article 320 vs 321, and good-faith compliance. Sister hubs: Restoration Intel, Healthcare Facility Hub, Continuity Hub, Risk Coverage Hub, and Tygart Media.

    If the number is real: the good-faith mitigation path

    The calculator above gives you the statutory exposure. What it cannot show is the mitigation mechanism DOB built into the same rule. Under 1 RCNY \u00a7 103-14(i)(2), an owner facing penalties in the 2024\u20132029 compliance period can seek mitigation by demonstrating good faith efforts \u2014 the fine is negotiated down or deferred through a mediated resolution, in exchange for documented, verifiable progress toward compliance.

    The standing prerequisites (all three, before any pathway counts):

    • Your annual building emissions report is filed, and you are complying with any adjustment DOB has granted.
    • You are in compliance with Local Law 84 benchmarking.
    • You are in compliance with Local Law 88 lighting upgrades and submetering.

    The principal pathway is a Decarbonization Plan: an energy audit and equipment inventory, concrete timelines and financing, and projected reductions on a path to net zero by 2050 \u2014 structured to bring the building within its 2024 limit within two years of submission, with DOB-approved applications in place by May 1, 2028 for the work the stricter 2030\u20132034 limits will require. Other qualifying showings include a financial-hardship adjustment under Administrative Code \u00a7 28-320.7 and, from 2025, having been under the prior year\u2019s limit.

    Read the protection correctly: it is conditional, not a waiver. Mitigation holds while the milestones hold. Miss them and DOB can cancel the arrangement and assess the deferred penalties retroactively. Two more mechanics matter to the math: renewable energy credits remain uncapped for electricity emissions in this period but qualify only from Tier 4 projects delivering into New York City (Champlain Hudson Power Express, Clean Path New York); and a building on the Decarbonization Plan pathway gives up REC use for the cycle \u2014 the plan route demands physical reductions, not purchased ones.

    Confirm your building\u2019s status and any mitigation filing in DOB records; this page explains the mechanism and does not state an outcome for any specific building.

  • Is Local Law 97 Only for NYC? What Long Island Commercial Buildings Actually Face in 2026

    Is Local Law 97 Only for NYC? What Long Island Commercial Buildings Actually Face in 2026

    Last updated: June 9, 2026. By Will Tygart. Written for Long Island commercial property and facility managers — including the verified negatives no one else publishes.

    Yes — Local Law 97 applies only inside New York City’s five boroughs. A commercial building in Nassau or Suffolk County has no LL97 obligation, no emissions cap, and no benchmarking filing due — and as of June 2026, neither county nor any Long Island town has adopted an equivalent. One disambiguation that trips up even the search engines: Long Island City is in Queens, which means LL97 fully applies there — and since Brooklyn and Queens sit on the geographic island of Long Island, a “Long Island portfolio” can absolutely contain covered buildings. The clean rule: coverage follows NYC Department of Finance tax lots, not geography.

    That is the myth busted. Here is what a Long Island commercial building actually faces in 2026 — which is not nothing.

    The applicability table (what applies on Long Island, really)

    Mandate Applies in Nassau/Suffolk? Status as of June 2026
    NYC Local Law 97 (emissions caps) No Five boroughs only — but it reaches your NYC buildings and your NYC-exposed tenants
    NYC LL84 benchmarking No No Nassau, Suffolk, Hempstead, or Islip benchmarking ordinance exists
    2025 NYS Energy Code (ECCCNYS) Yes In force statewide for permit applications filed on/after Dec 31, 2025 — no grace period; notably stricter air-leakage and air-barrier testing for commercial buildings
    All-Electric Buildings Act (new construction) Pending Enforcement suspended per the Nov 12, 2025 stipulation until ~4 months after the Second Circuit rules; towns may keep permitting fossil-fuel systems meanwhile
    Town of Babylon green building law Babylon only New commercial buildings ≥4,000 sqft must demonstrate LEED certification; $0.03/sqft fee (capped $15,000), refunded on certification — the one true local green mandate on the island
    NYS Part 253 mandatory GHG reporting Large facilities only 10,000+ tCO2e/yr facilities (large hospitals, campuses, industrial) track CY2026 now; first reports due June 1, 2027. Typical offices fall far below the threshold — but fuel suppliers report regardless
    NY cap-and-invest (carbon price) Indirectly, later Delayed to late 2026–2027; when live, allowance costs flow into LI heating fuel and gas prices

    Also worth knowing: New York State’s own climate law was just amended — the May 26, 2026 budget bill dropped the CLCPA’s 2030 milestone in favor of a softer 2040 target. Our full breakdown covers it; the short version for LI operators is that the state-level pressure eased while the city-level pressure (LL97) did not move an inch.

    So why do LI property managers keep getting carbon questions?

    Three channels reach Long Island operators without a single LI ordinance:

    1. Portfolio spillover. An LI-based management firm with even one NYC building over 25,000 sqft carries full LL97 exposure on it: the $268/tCO2e penalties, the May 1 reporting cycle (CY2025 grace ends June 30, 2026), and the 2030 caps that roughly 57% of covered buildings currently exceed. The firm’s compliance muscle has to exist anyway — the only question is whether it stops at the city line.
    2. Tenant and investor demand. GRESB-reporting owners and corporate tenants under California SB 253 and the EU’s CSRD need emissions data from their Long Island spaces and vendors regardless of New York law — the lease, not the legislature, is the enforcement mechanism. This is exactly the gap the Commercial Restoration Carbon Protocol covers on the vendor side.
    3. The coming fuel-price channel. Part 253 reporting puts LI fuel suppliers into the state’s carbon accounting now; when cap-and-invest launches, allowance costs arrive as operating expense, not as a filing.

    The carrot side: what an LI building can collect in 2026

    No mandates does not mean no money. The island’s two energy programs are unusually generous right now:

    • PSEG Long Island — Business First (announced March 2026): grants up to $125,000 for business customers, free commercial energy assessments, heat-pump HVAC and water-heater rebates (up to $1,200 for ENERGY STAR HPWHs), multifamily heating/cooling rebates of $4,000 per apartment ($5,000 in designated Disadvantaged Communities), EV make-ready up to $45,000 per charging plug, and a concierge “Business FIRST Advocate” service (PSEG LI). One LI-specific quirk: PSEG LI/LIPA runs its own programs outside the state’s Clean Heat utility pool — cite PSEG LI program pages, not Con Edison’s.
    • National Grid (LI gas): commercial rebates on high-efficiency boilers, water heaters, controls, and heat recovery — plus a gas demand-response program paying up to 15% of a building’s annual gas bill, rising to 20% when the incentive funds an efficiency project (National Grid).

    For an LI facility manager, the rational 2026 posture is: harvest the incentives while they are rich, build the data habit voluntarily, and let your NYC-exposed peers’ compliance pain be your preview.

    The watch-list (what would change this answer)

    • The Second Circuit ruling on the All-Electric Buildings Act — enforcement resumes roughly four months after a decision upholding it, hitting most new LI buildings under 7 stories and commercial under 100,000 sqft.
    • Statewide private-building benchmarking — bills like S838 (annual energy/water benchmarking for private buildings >50,000 sqft statewide) have been proposed but not enacted; passage would create LI’s first filing obligation.
    • Cap-and-invest litigation — courts have ordered DEC to move faster on economy-wide rules; the state’s appeal continues through 2026.

    This page is maintained against those three triggers — the “as of” date at the top is the tell.

    What this means for each seat at the table

    If you are the… On Long Island in 2026, your move is…
    Owner No LL97 line item — but if any NYC building is in the portfolio, its compliance calendar is yours, and lender/investor ESG questionnaires do not check county lines. Harvest PSEG/National Grid money on equipment you were replacing anyway.
    Facility / property manager Your binding documents are the 2025 NYS Energy Code on every permit and (in Babylon) the LEED ordinance on new commercial work. Build the vendor and energy data habit voluntarily now — the requests are coming from tenants before they come from Albany.
    Tenant (corporate occupier) Your SB 253 / CSRD / GHG Protocol obligations follow you onto Long Island even though LL97 does not — the restoration job in your Melville office is still your Scope 3 Category 1 line item.

    Frequently asked questions

    Is Local Law 97 only for NYC?

    Yes. LL97 covers buildings on New York City tax lots in the five boroughs. Nassau and Suffolk County buildings have no LL97 obligation — though Brooklyn and Queens, which sit on the geographic island, are fully covered, and Long Island City (in Queens) is covered despite the name.

    Does Long Island have its own building emissions or benchmarking law?

    No. As of June 2026, neither Nassau nor Suffolk County, nor towns including Hempstead and Islip, has adopted an energy benchmarking or emissions-cap ordinance. The one true local green-building mandate is the Town of Babylon’s LEED certification requirement for new commercial buildings of 4,000 square feet or more.

    What energy rules DO apply to a Long Island commercial building?

    The 2025 NYS Energy Code (ECCCNYS), in force statewide for permits filed on or after December 31, 2025 with no grace period; the suspended-but-pending All-Electric Buildings Act for new construction; and, for facilities emitting 10,000+ tCO2e a year, the Part 253 mandatory GHG reporting rule (first reports June 1, 2027).

    Will New York’s cap-and-invest program affect Long Island buildings?

    Indirectly, yes — when it launches (now expected late 2026 or 2027), fuel suppliers will pass allowance costs into heating fuel and natural gas prices. It arrives as an operating cost, not a compliance filing.

    My firm manages buildings in both NYC and Long Island — what should we do?

    Run one compliance program with two zones: full LL97/LL84 machinery for the NYC assets (the CY2025 grace deadline is June 30, 2026), and on the LI side, incentive harvesting (PSEG Business First, National Grid demand response) plus voluntary energy and vendor-carbon data collection so tenant and investor requests never catch you flat.

    Primary sources

    More in Local Law 97 and About BC ESG.

    Related reading: how to file Local Law 97, LL84 benchmarking as the LL97 prerequisite, and the Restoration Carbon Protocol. Sister hubs: Restoration Intel, Healthcare Facility Hub, Continuity Hub, Risk Coverage Hub, and Tygart Media.

  • Local Law 97 for Co-ops and Condos: The 2027 Board Budgeting Playbook, Reserve Financing & Exemption Pathways

    Local Law 97 for Co-ops and Condos: The 2027 Board Budgeting Playbook, Reserve Financing & Exemption Pathways

    Updated Nov 2, 2026 — refreshed 2027 board budgeting playbook, reserve study financing stack, Article 321 census protocols, and statutory relief pathways.

    As of October 6, 2026, co-op and condo boards should confirm LL97 pathway and CY2025 filing status in BEAM; the June 30 and August 29, 2026 filing deadlines have passed — this guide does not state outcomes for any building.

    November 2026 Board Action Checklist: 2027 Budget & Reserve Decisions

    With 2027 annual budget and reserve study cycles commencing this month, co-op and condominium boards must execute this four-step statutory triage before levying capital assessments or approving debt packages:

    1. Verify LL33 Label Posting & ESPM Cleanliness: Confirm physical entrance posting of the building’s 2026 Energy Efficiency Rating label (statutory deadline: October 31). Verify that prior-year Local Law 84 benchmarking in Portfolio Manager is reconciled without missing meter records; under 1 RCNY § 103-14, clean benchmarking is a mandatory prerequisite before DOB will review any mediated penalty relief or Decarbonization Plan filing.
    2. Calculate 2024–2029 Statutory Penalty Exposure: Calculate your property’s net emissions penalty liability using gross floor area, fuel splits, and the statutory penalty coefficient of $268 per metric ton of CO2e ($268/tCO2e) over the Article 320 occupancy limit. Model baseline exposure using the Local Law 97 fines calculator ($268/ton).
    3. Execute the Article 321 Census Test: Audit the building’s certified rent roll. Under NYC Administrative Code § 28-321, if more than 35% of dwelling units are rent-regulated or rent-stabilized, the building is legally exempt from Article 320 annual carbon caps and $268/ton fines. The board pivots immediately to verifying completion of the 13 Prescriptive Energy Conservation Measures (ECMs) rather than levying electrification special assessments. Compare pathway requirements in the Article 320 vs 321 decision guide.
    4. Evaluate § 28-320.7 Financial Hardship Relief (2035 Cap Deferral): For Article 320 properties facing acute capital constraints, determine whether the building’s average unit assessed valuation is below $65,000 per unit or capital retrofit outlays exceed 10% of property assessed value. Under NYC Administrative Code § 28-320.7 and 1 RCNY § 103-12, qualifying properties may petition the DOB for statutory adjustment and delayed compliance through 2035.

    If your co-op or condo building is over 25,000 square feet, Local Law 97 applies to you — but which version applies, and what it costs, depends on your building’s rent-regulation mix, and 2026 is the year one of the gentler pathways gets real. The legal challenge is over (the Glen Oaks suit — brought by a Queens co-op — lost at New York’s highest court in May 2025, with no appeal possible), the Council bill to delay penalties for moderate-value condos and co-ops died at the end of session, and multifamily buildings filed their first-year reports at a 94% rate. The question for boards is no longer whether LL97 is happening. It is which pathway you are on, and what the next capital plan should assume.

    First question: which pathway is your building on?

    LL97 is not one rule for all residential buildings — coverage splits on rent regulation and affordability status (DOB LL97 page):

    Pathway Who is on it What applies
    Article 320, standard (Pathway 0) Most market-rate co-ops and condos >25,000 sqft (or condo buildings sharing a board totaling >50,000 sqft) Emissions caps from 2024, annual RDP-certified reports, $268/tCO2e overage penalties
    Article 320, 2026 start (Pathway 1) Buildings with at least one but no more than 35% rent-regulated units Cap compliance began January 1, 2026 — this year is their first capped year
    Article 320, 2035 start (Pathway 2) Certain buildings under §28-320.3.9 Caps begin 2035
    Article 321, prescriptive (Pathway 3) >35% rent-regulated, HDFC co-ops, Mitchell-Lama, income-restricted, project-based federal housing One-time prescriptive energy measures (a defined checklist of upgrades) instead of caps; $10,000 penalties for non-compliance

    Your pathway is shown on the Covered Buildings List published each year on DOB’s LL97 page; disputes go through a BEAM portal ticket. If your building has a mix of rent-regulated units, checking the percentage against DOF records is the single highest-value hour a managing agent can spend this year — Pathway 1 buildings are in their first capped year right now, and many boards do not know it.

    The math boards actually face

    The multifamily emissions cap for 2024–2029 is 0.00675 tCO2e per square foot (1 RCNY 103-14). For a 120,000 sq ft co-op, that is an annual limit of 810 tCO2e. Exceed it by 100 tons and the penalty is $26,800 a year. Fail to file at all and the penalty is 120,000 × $0.50 = $60,000 per month — which is why “we’re under the cap so we don’t need to do anything” is the most expensive sentence in co-op governance. Filing is mandatory regardless of emissions; for most buildings under the cap it costs the $210 fee plus the engineer.

    About 9% of covered properties exceed today’s caps — but roughly 57% exceed the 2030 caps (Urban Green Council). For residential boards the 2030 number is the one that belongs in the reserve study, because the realistic retrofit menu — heat pump conversions, window and envelope work, boiler replacement timed to end-of-life — takes more than one budget cycle to finance and execute. Habitat’s reporting captured the honest owner calculus: some owners are choosing fines over retrofits because, as one put it, eliminating the fine would cost “15 to 20 times the fine amount” (Habitat, March 2025). That math can be rational in 2026 — and flips as the caps tighten and the fines repeat annually, forever.

    What boards hoping for a rescue should know

    • The lawsuit is over. Glen Oaks Village Owners — a Queens garden co-op — argued the state climate law preempted LL97. The NY Court of Appeals rejected the challenge on May 22, 2025 (opinion); as a state-law ruling from the highest court, it cannot be appealed further.
    • The relief bills stalled. Int 1197 (Lee/Ung), which would have delayed penalties for condos and co-ops with average unit assessed value under $65,000, was never moved by the Speaker; Int 1180’s REC cap also died at end of session. No amendment has touched the $268 rate, the caps, or the May 1 cycle.
    • Enforcement has started. DOB’s April 22, 2026 release: 93% of covered properties filed, ~1,400 non-filers are receiving Notices of Deficiency, and OATH penalty cases are being prepared (DOB press release).

    The board playbook for 2026

    October 2026 status: The June 30, 2026 statutory deadline and the August 29, 2026 extended deadline (for buildings that secured a $60 extension by June 30) are both in the past. Use DOB BEAM and DOB NOW records to verify whether your building filed; this article does not state filing outcomes for any property.

    1. Confirm your pathway and filing status in BEAM today. As of October 6, 2026, the June 30, 2026 and August 29, 2026 CY2025 filing deadlines have passed; verify whether your building filed rather than assuming an outcome. See the LL97 2026 deadlines reference.
    2. Get the real number before the meeting. An energy audit that converts “we might be over” into “we are 110 tons over, which is $29,480 a year, and these three measures close 80% of it” changes the quality of every board conversation that follows.
    3. Time retrofits to equipment life, not to panic. The cheapest decarbonization is the boiler you were going to replace anyway, replaced with the electric option, with the beneficial-electrification credits that remain richest before December 2026.
    4. Know the mitigation menu before you need it: good-faith-efforts (requires filed reports + current LL84 + LL88 attestation plus a qualifying path like an RDP-certified decarbonization plan); RECs (electricity-attributable emissions only, NYC-deliverable); AHRF offsets (capped at 10% of your limit, $268/ton); and after a fire or flood, the disaster provision that can zero a penalty year with documentation (1 RCNY 103-14(i)(1)).
    5. Use the free help. NYC Accelerator provides no-cost LL97 compliance guidance, and the Building Energy Exchange published a co-op/condo-specific playbook, Cutting Carbon in Co-ops & Condos, in May 2026.

    What this means for each seat at the table

    If you are the… LL97 in 2026 means…
    Board (the owner) The penalty exposure and the capital plan are yours. Put the 2030 number in the reserve study now; annual fines are a recurring line item, not a one-time fee.
    Managing agent (the coordinator) Pathway verification, the three-portal filing chain, the RDP booking, and the mitigation paperwork run through you — including the disaster documentation if the building ever floods or burns.
    Shareholders / unit owners (the residents) LL97 costs reach you through maintenance and common charges either as planned retrofit financing or as unplanned fines — and the planned version is almost always cheaper. The A–F energy grade at the entrance is your building’s public report card.

    Frequently asked questions

    Does Local Law 97 apply to co-ops and condos?

    Yes — co-op and condo buildings over 25,000 square feet (or condo buildings under one board totaling over 50,000 square feet) are covered. The applicable pathway depends on rent-regulation and affordability status: most market-rate buildings face Article 320 caps; buildings over 35% rent-regulated, HDFC, and Mitchell-Lama follow Article 321’s one-time prescriptive measures instead.

    What is the LL97 penalty for a co-op?

    The same as any Article 320 building: (actual emissions minus the cap) × $268 per ton CO2e per year, and $0.50 per square foot per month for failing to file. Article 321 buildings face $10,000 penalties for late or missing compliance reports.

    What changed for partially rent-regulated buildings in 2026?

    Buildings with at least one but no more than 35% rent-regulated units (Pathway 1) began cap compliance on January 1, 2026 — 2026 is their first capped calendar year, reportable in 2027.

    Did the co-op lawsuit against LL97 succeed?

    No. Glen Oaks Village Owners v. City of New York was decided against the challengers by the NY Court of Appeals on May 22, 2025, and cannot be appealed further. LL97 is settled law.

    Will LL97 raise my maintenance or common charges?

    For buildings over their caps, yes — the only question is whether the increase funds planned retrofits (often with incentives, and timed to equipment replacement) or recurring annual fines. The retrofit usually wins over a ten-year horizon, especially with 2030’s stricter caps.

    Where can a board get free LL97 help?

    NYC Accelerator (accelerator.nyc/ll97) offers free compliance guidance, and the Building Energy Exchange’s May 2026 “Cutting Carbon in Co-ops & Condos” playbook is written specifically for residential boards.

    Primary sources

    More in Local Law 97 and About BC ESG.

    Related reading: board resolution checklist, Article 320 vs 321, and LL97 2026 filing deadlines (reference). Sister hubs: Restoration Intel, Healthcare Facility Hub, Continuity Hub, Risk Coverage Hub, and Tygart Media.

    Co-op and Condo Capital Financing Stack: Eliminating Lump-Sum Special Assessments

    The primary political crisis facing co-op and condo boards is the shareholder assessment revolt. When boards present heating plant decarbonization or envelope retrofits as lump-sum capital calls ($20,000 to $50,000 per apartment), shareholders routinely threaten board recalls or litigation. Modern decarbonization governance structures CapEx through long-term, non-accelerating financing instruments layered with utility rebates.

    Financing Mechanism Term & Security Impact on Shareholder Lien / Resale Eligible Project Scope
    C-PACE (Commercial PACE) 20–30 year fixed-rate financing repaid as a senior voluntary tax assessment via municipal property tax bill. Transfers automatically with title upon unit sale; never accelerates upon sale; does not impair individual shareholder mortgageability. 100% of hard and soft costs: engineering, electrical switchgear upgrades, heat pumps, building envelope, solar PV.
    NYCEEC Clean Energy Debt 5–15 year term loans; subordinated debt or co-op building loan structures. Secured by building underlying cash flow or assignment of maintenance dues; requires lender consent. Pre-development studies, design engineering, electrical service risers, heating plant electrification.
    Con Edison Clean Heat Rebates Direct utility capital incentives paid upon verified installation and commissioning. Non-debt capital infusion directly reducing project net borrowing requirement. Full-load heat pump space heating (up to $5,000 per dwelling unit market-rate; $12,000–$14,000 affordable) plus DHW heat pumps ($1,000/unit), or custom performance ($200/MMBtu).
    10-Year Reserve Amortization Integrated reserve study allocation paired with annual operating budget escalation (1.5%–3.0%). Predictable maintenance charge trajectory; prevents sudden special assessment notices during unit resales. Phased prescriptive retrofits according to the Retrofit Priority Stack for Existing Buildings (air sealing, steam balancing, smart thermostats).

    Board Resolution & Shareholder Communication Package

    To establish institutional protection against breach-of-fiduciary-duty claims, boards should adopt formal resolutions authorizing technical feasibility studies and establish transparent shareholder communications well in advance of vote milestones.

    Sample Board Resolution: Engineering Decarbonization Audit & PE/RA Engagement

    “WHEREAS, the Corporation is subject to the building energy performance standards and greenhouse gas emissions limitations of NYC Administrative Code § 28-320 (Local Law 97); and

    WHEREAS, compliance requires professional engineering analysis of heating plant electrification, electrical service capacity, and capital amortization options;

    NOW, THEREFORE, BE IT RESOLVED, that the Board of Directors hereby approves the retention of a New York State licensed Professional Engineer (PE) or Registered Architect (RA) to perform an ASHRAE Level II Energy Audit, electrical load letter evaluation, and statutory Article 320/321 compliance pathway analysis; and

    BE IT FURTHER RESOLVED, that the Treasurer and Managing Agent are authorized to solicit non-accelerating financing proposals, including C-PACE financing structures and utility incentive pre-approvals, to present an integrated Decarbonization Capital Plan at the upcoming Shareholder Informational Meeting.”

    Shareholder Town Hall Structure: Cost of Inaction vs. Decarbonization

    When presenting compliance proposals to shareholders, boards must contrast the Cost of Inaction against the Cost of Financed Decarbonization:

    • Cost of Inaction: Accumulating annual DOB penalties ($268/tCO2e) beginning in the 2024–2029 cycle and escalating steeply in 2030, compounded by fossil fuel commodity price volatility, deteriorating LL33 letter grades (D or F posted at building entrance), and lender scrutiny on unit buyer mortgages.
    • Cost of Decarbonization: Net capital outlay after utility equipment rebates, amortized over 20–25 years via C-PACE or energy debt. Because C-PACE is repaid through property tax assessments and transfers with unit title, departing shareholders pay only for their tenure of ownership, while lower operating EUI permanently reduces building operating expenses.

    Resale Questionnaire & Lien Search Disclosures

    Managing agents must prepare for increasing disclosure requirements on co-op lien searches and institutional buyer questionnaires. Institutional mortgage lenders (including Fannie Mae, Freddie Mac, and private portfolio lenders) now routinely request evidence of LL97 pathway classification, outstanding DOB violations, and projected special assessment liabilities. Boards that fail to adopt an approved capital compliance plan risk having buyer financing rejected by lender underwriting departments. For step-by-step administrative submission protocols, review How to File Local Law 97 on DOB NOW, ESPM, and BEAM.

    Notice on Co-op/Condo Governance: This guidance is prepared for condominium unit owners, cooperative shareholders, board directors, and managing agents for capital budgeting and compliance strategy. Regulatory standards reflect NYC Administrative Code § 28-320 and 1 RCNY § 103-14. This analysis does not constitute formal legal counsel, certified engineering filings, or licensed financial underwriting. Boards must consult their corporate legal counsel, managing agent, and a New York State licensed Professional Engineer (PE) or Registered Architect (RA) prior to executing capital assessments or filing compliance documents.

BC ESG

ESG Strategy, Sustainability Intelligence, and Business Continuity for Forward-Thinking Organizations

© 2026 BC ESG — Business Continuity, ESG & Sustainability Intelligence