Blog

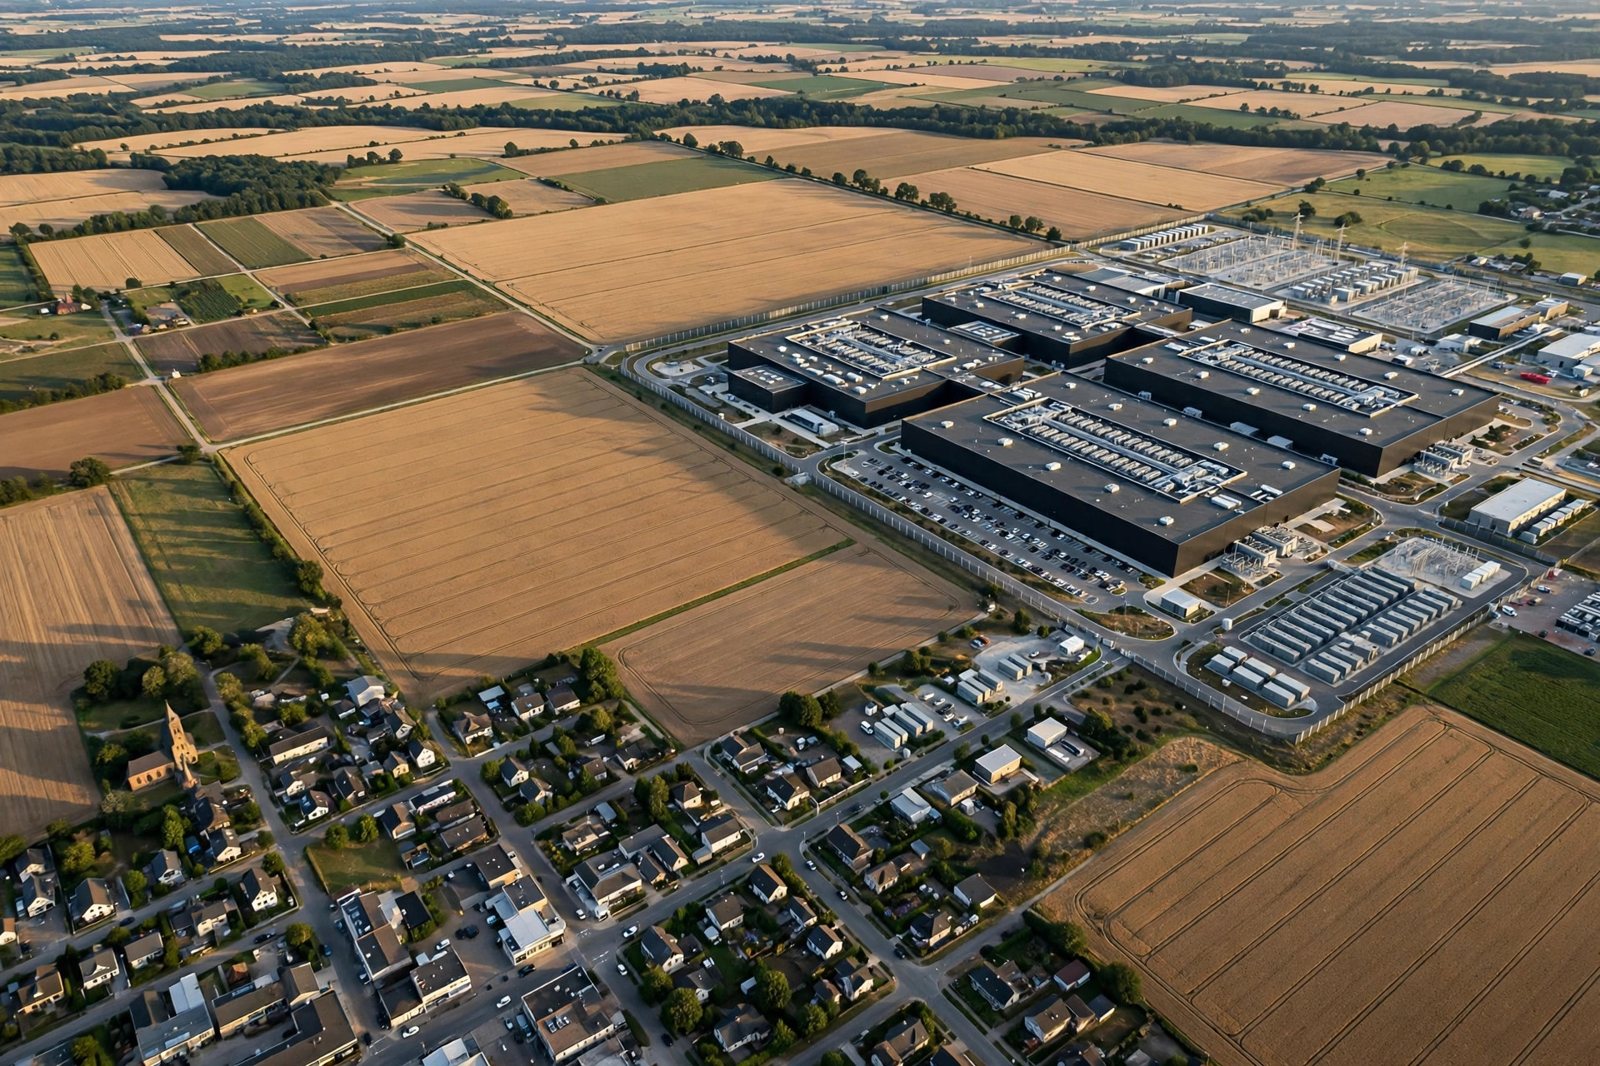
  • The Data Center Oversight Act: What Operators Would Have to Put in Public

    The Data Center Oversight Act: What Operators Would Have to Put in Public

    A data center deal usually arrives in a community the same way: a codename, a closed session, and a nondisclosure agreement. A new federal bill proposes to reverse that order. The Data Center Oversight Act, introduced in the House on October 29, 2026 by Rep. Eugene Vindman of Virginia, would make the Energy Information Administration collect — and publicly report — a standard set of facts about every existing and proposed data center in the country. For developers and host communities alike, the practical question is simple: exactly what becomes public? Here is the checklist, as written.

    What is being proposed

    The Act would require the Energy Information Administration (EIA), within the Department of Energy, to collect and publicly report comprehensive information on both existing data centers and proposed developments. Operators submit the information; EIA publishes it.

    Status: this is an introduced bill, not law. It was introduced October 29, 2026, and has the long committee road in front of it. But disclosure bills like this one also move the market before they move Congress — the checklist below is already a fair preview of what host communities, journalists, and competitors will ask for in 2027 whether or not the bill passes.

    The disclosure checklist

    Under the Act, operators would have to report:

    • Ownership — who actually owns the facility.
    • Energy usage — expected or actual electricity consumption.
    • Water usage — expected or actual water consumption.
    • Ratepayer costs — the costs of serving the facility that may be passed on to utility ratepayers.
    • Nondisclosure agreements — whether the facility’s owners have signed NDAs with government officials.
    • Union labor — whether union labor was used in construction.
    • Sensitive proximity — whether the facility sits within 1,000 feet of a school, a national park, a hospital, or a home.

    Read the list as a community would. Energy and water are the resource questions every county hearing now runs on. The ratepayer-cost item goes at the subsidy argument directly: not what the facility pays, but what its presence costs everyone else on the grid. And the proximity item converts the most emotional local question — how close is this thing to where people live, learn, and recover — into a yes/no federal data point.

    The NDA item is the sharp edge

    Most of the checklist asks for numbers. The nondisclosure item asks for a fact about secrecy itself: not the contents of any agreement — the Act does not reach those — but whether one exists between the developer and government officials.

    That single yes/no changes local politics. Today, a resident who asks why a project was negotiated in private can be told nothing at all. Under the Act, the existence of the NDA is itself a disclosed, federally reported fact. Developers who treat confidentiality as the default opening move would be making that choice in public.

    What does getting it wrong cost?

    Entities that fail to report, submit incomplete information, or provide misleading information face penalties of up to $1 million per day.

    The structure matters as much as the number. The penalty covers three distinct failures — silence, incompleteness, and inaccuracy — and it runs per day, which means a disclosure problem is not a fine you budget for; it is a clock that runs until the filing is right. At that scale, disclosure stops being a communications task and becomes a compliance function with records, owners, and review — the same treatment environmental and financial reporting already get.

    This bill does not arrive alone

    The Oversight Act is Vindman’s third data-center measure of 2026. In October he introduced the Make Data Centers Pay Act, aimed at shielding households and small businesses from electricity costs driven by data-center demand. In August, the Smart Data Center Policy Act took up development near neighborhoods, schools, and parks. Read together, the three bills mark the shape of the federal argument: who pays, where it goes, and — with this Act — who has to say so, in public, in advance.

    The state and local layer is moving the same direction. Water and energy disclosure fights now attach to individual projects, and the physical-risk questions communities ask — water scarcity chief among them — have become standard diligence, not activism.

    What a developer or a host community should do now

    You do not need the bill to pass to use the checklist. For a developer, it is a pre-announcement inventory: for any live or proposed site, could you answer all seven items today, accurately, from records? Ownership structures, utility-service cost allocations, and construction-labor facts are easy to state early and hard to reconstruct under a per-day clock. For a host community, the checklist is the term sheet for your own questions — ask for these seven items in the first public session, while the answers are still cheap.

    The industry’s growth is not the controversy anymore. The controversy is whether the facts arrive before the concrete does. This bill’s answer is a form, filed with the EIA, where anyone can read it.

    Informational only — this article summarizes the Data Center Oversight Act as introduced on October 29, 2026, per the sponsor’s published summary and contemporary reporting; it is not legal advice, and a bill’s text and prospects can change. Sources: Office of Rep. Eugene Vindman (Oct 29, 2026); Nextgov/FCW, “Tech bills of the week” (Oct 30, 2026).

  • Portland’s Proposed Building Carbon Standards, Explained: The Step-Down to Zero by 2050

    Portland’s Proposed Building Carbon Standards, Explained: The Step-Down to Zero by 2050

    Portland is considering the most literal building decarbonization schedule in the country: not a target with a plan to have a plan, but a staircase written into city code — cut your building’s greenhouse gas intensity by 20 percent, then 20 percent again, every five years, until it reaches zero in 2050. The proposal is still moving through City Council, and the details matter for any owner of a larger commercial or multifamily building in the city. Here is what the ordinance actually says.

    What is Portland proposing?

    The proposal is Ordinance 2026-377, which would replace City Code Chapter 17.104 with a new chapter: Climate and Health Standards for Buildings. Its stated purpose is to reduce carbon emissions from commercial and multifamily residential buildings to zero by 2050, and to give tenants information about the affordability, health, and resilience of rental housing.

    Status matters here: this is a proposal, not a law. The Sustainability and Climate Commission endorsed it in August 2026. The Housing and Permitting Committee took it up on October 20, 2026 and continued it to December 1, 2026 — so the next decision point is December 1, and the draft can still change. Everything below describes the ordinance as currently written.

    Which buildings would be covered?

    Covered buildings are commercial buildings and residential buildings with four or more dwelling units, with specified exclusions. The carbon performance standards apply to covered buildings of at least 20,000 square feet.

    Reporting comes first. Annual energy performance reporting would apply to covered buildings of at least 20,000 square feet beginning June 1, 2028. That is an extension of familiar ground: Portland has run a Commercial Building Energy Reporting Program since 2015, and in 2025–2026 the city piloted multifamily reporting with five properties. The pilot found the first year of benchmarking took 3 to 9 hours of active staff time (median 6), and participants expected two hours or less in later years.

    How does the step-down work?

    The standard is a greenhouse gas intensity (GHGI) target — emissions per square foot — that tightens in 20-percent increments every five years, beginning with the 2030 performance standard and reaching zero carbon emissions by 2050.

    Zero means zero. The code defines the final standard as a GHGI of zero without the use of offsets, renewable natural gas, or unregulated credit mechanisms. There is no buying your way to the last step.

    One provision works in owners’ favor: the code’s emissions factors are designed to account for Oregon’s clean-energy targets, so as the electric grid gets cleaner, an electrified building’s measured intensity falls with it. Efficiency and electrification do the rest.

    What happens if a building misses its standard?

    It pays a carbon pollution impact fee. For the first interim standard, the ordinance sets the cost of carbon at $380 per metric ton of CO2e per year, charged on emissions above the building’s target.

    Three features of the fee are worth knowing:

    • It ratchets. Future rates are set by the City Administrator, reviewed at least every five years, and approved by Council — and a future fee may not be lower than the fee for the previous interim standard.
    • The money is locked to compliance. Fee revenue goes into a dedicated fund used solely to support compliance with the chapter — grants, technical assistance, and financing for retrofits — with priority for regulated affordable housing, naturally occurring affordable housing, small property owners, and buildings serving low-income or climate-vulnerable tenants. Administrative costs paid from the fund are capped at seven percent.
    • It is also an off-ramp in hard cases (see below).

    What are the off-ramps?

    The ordinance builds in flexibility, because a hard staircase meets buildings that genuinely cannot climb it on schedule:

    • Extensions and exemptions for specified circumstances.
    • Alternate Compliance Plans for qualifying campus portfolios with shared utility services — a provision shaped by higher-education and institutional owners whose energy systems serve whole campuses.
    • A full exemption from both the carbon performance standards and the impact fee for regulated affordable housing.
    • A displacement escape valve: if required whole-building upgrades would force tenant relocation for more than ten calendar days or termination of a tenancy, the City Administrator may authorize compliance through payment of the impact fee instead of the upgrades.

    At least once every five years after 2030, the City Administrator must also publish an impact report — covering displacement, implementation costs, electric-system capacity and reliability, and utility-cost impacts — with recommendations for adjusting the program or its timeline.

    What changes for tenants?

    The standards’ costs may not be passed through to residential tenants. Beyond that, the chapter adds a tenant-information layer that starts before the first carbon standard bites:

    • Beginning January 1, 2028, prospective tenants get climate and health information, including utility costs and energy assistance, cooking fuel and ventilation, and mechanical and passive cooling.
    • Beginning June 1, 2028, residential covered buildings complete a climate and health inventory every five years.
    • When upgrades require temporary relocation, owners must file a tenant impact plan — addressing temporary housing and, where applicable, moving, storage, and transportation assistance — and guarantee a right to return to the same unit.

    What should an owner do while this is still a proposal?

    Three things. First, watch December 1 — that is when the committee takes the ordinance up again. Second, if your building already benchmarks under the 2015 reporting program, treat that data as the foundation it is: a step-down schedule measures every future cut against your baseline, so a sloppy baseline becomes a permanent handicap. Third, read the proposal alongside the other performance-standard regimes now stacking up — Washington D.C.’s BEPS pathways and New York’s LL84/LL97 benchmarking-and-limits sequence are the closest cousins, and portfolios that span cities are already learning to run one compliance calendar for all of them.

    Portland’s draft is unusually honest about its own mechanics: the steps, the price of missing one, and the exits are all on the page. Whether Council adopts it as written is the December question.

    Informational only — this article summarizes a proposed ordinance (Portland Ordinance 2026-377) as published by the City of Portland; it is not legal or compliance advice, and the proposal may change before adoption. Primary source: the City of Portland’s ordinance page for the Climate and Health Standards for Buildings Code.

  • How Do Lenders Finance Homes That Aren’t Financeable Yet?

    How Do Lenders Finance Homes That Aren’t Financeable Yet?

    A lender looking at an inefficient home faces a simple fork: lend against the building as it stands, or lend against the building it could become. A new cross-industry white paper, The Trillion-Dollar Housing Transition, published by the Sustainable Real Estate Forum (SREF) in October 2026, argues the second option is where the market now has to learn to work — and that the shortage holding it back is not money. It is the ability to originate, underwrite and execute credible transition pathways at scale.

    The paper was written with contributions from GlobalABC, RICS, the European Mortgage Federation (EMF-ECBC), PATRIZIA, Optiml, pbb Deutsche Pfandbriefbank and INREV, and SREF will distribute it in the Blue Zone at COP31 in Antalya, Türkiye. Its lending chapter, from pbb, reduces the lender’s job to a three-part test: finance the cure, price the residual risk, and withdraw only when neither is credible.

    What is SREF actually claiming?

    The claim is that affordable housing and climate action have to be delivered together, and that capital is not the binding constraint on doing it. “A home that is cheap to build but costly to cool, unsafe in floods or heatwaves, or dependent on high-carbon materials is not affordable over its lifetime,” the paper states. The bottleneck, in SREF’s account, sits one step earlier than the money: in whether the market can produce enough well-evidenced, underwritable retrofit and building pathways for the capital to attach to.

    The scale behind that claim is large by any measure. UN-Habitat estimates that by 2030 three billion people will need access to adequate housing — around 96,000 new affordable and accessible homes every day. Buildings’ operational emissions reached 9.9 GtCO₂ in 2024 and, according to UNEP, would need to fall by 56% by 2030 to align with a net-zero pathway. Roughly 80% of growth in building floor area through 2030 is expected in emerging and developing economies, where underwriting capacity is thinnest.

    Where does the “trillion-dollar” figure come from?

    “Trillion-dollar” is the paper’s framing of the overall scale, not a single line item. SREF’s founder and CEO, Peter Panayi, puts it this way: “The housing transition is a trillion-dollar challenge, but it is also a trillion-dollar opportunity.” The hardest number underneath the framing comes from UNEP: cumulative investment in building energy efficiency needs to reach around USD 5.9 trillion by 2030, compared with roughly USD 2.3 trillion invested between 2015 and 2024.

    The investor side of the ledger supports the “capital is available” half of the argument. €117 billion was raised for non-listed real estate in 2025, and 87% of surveyed managers expect the amount raised to increase over the next two years. INREV estimates Europe needs more than two million new homes a year — around 650,000 more than it builds today — requiring about €153 billion of additional investment each year. The question the paper presses is not whether that money exists. It is whether lenders can tell, home by home, which transition plans deserve it.

    What does “finance the cure” mean in practice?

    It means the lender’s first question about a poor-performing home changes. Instead of asking whether the asset is financeable today, the lender asks whether it can become financeable through a pathway that is credible, funded and capable of being monitored. As Lara Knapwost, Head of ESG at pbb Deutsche Pfandbriefbank, writes in the paper: “Real estate transition is not primarily about buildings that are already efficient and financeable today. The task for lenders is to identify the assets that can become financeable through a credible, funded and monitorable pathway, and to actively support them.”

    Each of those three adjectives does work. Credible means the retrofit or improvement plan is technically real for that building, not a generic pledge. Funded means the money for the works is actually assembled, including any subsidy or affordability support the household needs. Monitorable means the lender can check, over the life of the loan, whether the pathway is being delivered. A plan that fails one of the three is not a cure — it is a hope, and the test says not to price it as one.

    This is where the desk work already familiar to BC ESG readers connects. Deciding which measures come first in an existing building is the problem the Retrofit Priority Stack for Existing Buildings works through; the SREF test adds the lender’s side of the same table — which of those stacked measures, properly sequenced and funded, turns an unfinanceable asset into a lendable one.

    How should lenders price the residual risk that remains?

    Even a well-funded cure leaves risk behind: the works may underperform, energy prices and policy may move, and some homes will still sit below standard at the end of their pathway. The paper’s second instruction is to price that residue openly rather than pretend the cure erased it — or use it as a reason to refuse the loan outright.

    The valuation profession is where this pricing is supposed to become visible. RICS and EMF-ECBC argue that transition risk should become a material input to property valuation where it is supported by evidence. “Where transition risk is material and evidenced, valuers should be supported to reflect it,” says Sander Scheurwater, Head of Benelux at RICS. “The market’s ability to price both action and inaction will be central to the housing transition.” His colleague Gina Ding, RICS Head of Public Affairs Europe, describes the machinery: “Standards create the common language, data creates the evidence, and skilled valuers turn that evidence into professional judgement. When valuation is transparent, capital can tell apart the homes that need investment from those where investment protects value.”

    Pricing inaction matters as much as pricing action. A lender who prices only the risk of a retrofit pathway, and never the risk of holding a book of homes with no pathway at all, will systematically make the wrong call — the stranded-asset end of transition risk arrives through the loans that were never restructured, not just the ones that were. Jennifer Johnson, Deputy Secretary General of EMF-ECBC, ties the threads together: sustainability, valuation and mortgage finance have to align, with a robust understanding of how energy performance relates to property value and financial risk.

    Why can a credible plan still fail to deliver?

    Because a spreadsheet is not a building site. PATRIZIA and Optiml show that a portfolio can have a technically credible decarbonisation plan and still fail to deliver it — because contractors are unavailable, permits take too long, grid capacity is constrained, or households cannot absorb the cost. Nico Dehnert, co-founder of Optiml, is blunt about the substitutes: portfolios “will not be delivered through ESG reports, generic benchmarks or static plans,” but through “credible, investable pathways that connect building reality, financial goals, affordability and execution constraints.”

    So underwriting a pathway means underwriting its delivery chain, not just its engineering. Shreya Sheth of PATRIZIA calls the standard “decision readiness”: multiple investable pathways compared through a common financial and transition logic, so when one route blocks — a permit stalls, a contractor shortage bites — the financing can move to another route instead of dying.

    What do lenders need before they can do this at scale?

    The paper’s closing chapter, from INREV, answers with an Institutional Housing Compact: institutional capital can scale where three conditions hold. Policy must be stable, so a pathway underwritten today is not stranded by a rule change tomorrow. Affordability obligations must be explicitly funded, rather than silently loaded onto borrowers or lenders. And evidence must be common from asset to fund, so risks, returns and outcomes stay comparable as a home’s data travels up into a portfolio. “Capital follows the compact,” writes Jeff Rupp, INREV’s Director of Public Affairs: “stable rules, funded affordability and evidence that survives from asset to fund.”

    That evidence condition is the one lenders control most directly. The discipline of assembling climate and continuity evidence a lender can actually rely on is covered in BC ESG’s Lender and Investor Evidence Pack, and the wider lending and disclosure context sits in ESG in Banking and Investment: Risk, Lending, and Disclosure. GlobalABC’s opening chapter makes the matching point at country level: global commitments only convert into housing when they become country-owned delivery systems.

    And withdrawal? The test’s third clause is deliberately narrow: a lender withdraws only when neither side works — no credible cure can be financed and the residual risk cannot be honestly priced. It is the last resort of the test, not its default.

    Frequently asked questions

    What is The Trillion-Dollar Housing Transition?
    It is a white paper published by the Sustainable Real Estate Forum (SREF) in October 2026, with contributions from GlobalABC, RICS, EMF-ECBC, PATRIZIA, Optiml, pbb Deutsche Pfandbriefbank and INREV. It argues that affordable housing and climate action must be delivered together, and it will be distributed in the Blue Zone at COP31 in Antalya, Türkiye.

    Why does the paper say capital is not the constraint?
    Because the investment need — UNEP estimates cumulative building energy-efficiency investment of around USD 5.9 trillion is needed by 2030 — sits alongside demonstrated investor appetite, including €117 billion raised for non-listed real estate in 2025. The paper argues the binding limit is the market’s ability to originate, underwrite and execute credible transition pathways at the scale the capital requires.

    What is the lender’s three-part test in the paper?
    From pbb Deutsche Pfandbriefbank’s chapter: finance the cure, price the residual risk, and withdraw only when neither is credible. In practice: first ask whether a home can become financeable through a credible, funded and monitorable improvement pathway; then price whatever transition risk remains, transparently, through valuation; and treat withdrawal as a last resort.

    What does “residual risk” mean for a home that has a retrofit plan?
    It is the transition risk left over after the planned works: underperformance of the measures, energy-price and policy movement, and any gap between the home’s end state and the standard the market will expect. RICS argues valuers should reflect that risk in valuations where it is material and evidenced — alongside the risk of inaction, which often goes unpriced.

    Does this change anything for an individual borrower today?
    Not directly — nothing in the paper is a lending decision about any individual home. It signals direction: lenders are being urged by their own industry bodies to build underwriting that rewards credible improvement pathways and to put transition risk into valuations. Whether and when any specific lender adopts that is that lender’s decision.

    Sources

    • SREF / PR Newswire launch release for The Trillion-Dollar Housing Transition (28 October 2026), including quotes from Peter Panayi (SREF), Lara Knapwost (pbb Deutsche Pfandbriefbank), Sander Scheurwater and Gina Ding (RICS), Jennifer Johnson (EMF-ECBC), Shreya Sheth (PATRIZIA), Nico Dehnert (Optiml) and Jeff Rupp (INREV), and figures attributed there to UN-Habitat, UNEP and INREV.

    This article is general information about a published industry paper. It is not investment, lending or financial advice, and it is not a recommendation for or against any product, property or course of action.

  • Board Oversight & ESG-Linked Executive Compensation: Aligning C-Suite Pay with 2026 Performance Targets

    Board Oversight & ESG-Linked Executive Compensation: Aligning C-Suite Pay with 2026 Performance Targets

    A board governance blueprint for compensation committees, chief sustainability officers, and legal counsel.

    Connecting executive compensation to ESG performance has moved from a qualitative signalling exercise into a standing governance question for global enterprises: not whether sustainability belongs anywhere near the pay plan, but how a committee structures the link so it survives investor scrutiny, proxy-advisor methodology, and its own disclosure. This blueprint sets out the architecture — what the advisors actually test, what disclosure law requires, how to weight and safeguard the metrics, and the sequence a board runs for the 2026 performance cycle. It sits above the sector verticals in this series — pharmaceutical companies’ ESG executive compensation and beauty companies’ executive pay and sustainability targets — and draws its metric mechanics from the fleet’s KPI design framework for ESG performance.

    Board Governance Toolkits

    2026 ESG-Linked Pay Toolkits: Quick Card, Committee Pack & Board Pay Bot Book

    Printable allocation models, 50/100/150 gates worksheets, proxy-advisor disclosure checklists, and machine-executable AI audit routines built directly from our board governance blueprint.

    Field Reference
    FREE

    ESG-Linked Pay Quick Card

    2-page field summary: the STI (10–15%) and LTI (15–25%) weight bands, 50/100/150% gates grid, 4-metric reference table, and ISS/Glass Lewis disclosure test on one card.

    Download Free PDF

    Direct download • No email gate

    Working Pack
    $7

    2026 Committee Pack

    7-sheet printable/fillable pack: STI/LTI variable pay allocation worksheet, 50/100/150% gates grid, 4-metric data lineage log (>80% Tier-1, CSRD/IFRS S1/S2, 6.5% Scope 1+2, zero LL97 $268/ton fines), ISS/Glass Lewis checklist, CSRD GOV-3 & SB 253/261 checklist, verification worksheet, clawback contract clauses, and sector benchmark table.

    Get Committee Pack ($7) →

    Instant checkout • Square verified

    AI Intensive
    Book for Bots
    $17

    Board Pay Bot Book

    Feed to ChatGPT or Claude: 5 interactive AI routines (Proxy-Advisor Disclosure Stress-Test, Regulatory Disclosure Floor Mapper, STI/LTI Architect, Safeguard & Clawback Integrator, Q1-Q4 Board Roadmap Runner) + embedded command router.

    Get Bot Book ($17) →

    Software made of words • Instant delivery

    What ISS and Glass Lewis actually do — and do not — require

    The load-bearing fact first, because it is widely overstated: neither ISS nor Glass Lewis requires a company to tie variable executive pay to sustainability metrics. Their 2026 guidelines discipline two things — pay-for-performance alignment and the quality of disclosure. They test whether incentive structures are rigorous, whether performance goals are objective and measurable, whether the committee discloses weights, targets, and outcomes, and whether payouts follow the disclosed design. Where a board chooses ESG metrics, the advisors apply the same tests they apply to financial metrics: a stated weight, a quantified target, an outcome the shareholder can recompute. An ESG metric that is vague, discretionary, or paid out regardless of result draws exactly the criticism a soft financial metric would.

    The same discipline comes from the large institutional asset managers — BlackRock, Vanguard, and State Street among them — whose stewardship teams ask, in engagement and in published voting guidance, for a disclosed rationale connecting incentive design to strategy and long-term value. None of this mandates an ESG pay metric. All of it raises the cost of a badly built one. A compensation committee that adopts sustainability metrics should therefore build them to the standard the advisors will grade: transparent, quantifiable, and verified before they pay.

    The disclosure floor underneath the design

    Three regulatory regimes convert sustainability performance into standing disclosure obligations that a pay plan then samples from:

    • EU CSRD & ESRS. In-scope companies report under the European Sustainability Reporting Standards, including a double materiality assessment and governance disclosures. ESRS 2 (GOV-3) requires a company to disclose whether and how sustainability performance is taken into account in its incentive schemes — the pay link itself is reportable, whether the answer is a detailed structure or none at all.
    • California’s climate statutes (SB 253 & SB 261). Enterprise-wide Scope 1, 2, and 3 greenhouse gas reporting and climate-related financial risk disclosure, on hard regulatory submission dates, for companies doing business in California above the revenue thresholds.
    • Municipal building performance standards. Frameworks such as New York City’s Local Law 97 impose carbon intensity limits on large buildings backed by penalties of $268 per metric ton of CO2e over the limit — a recurring operating cost that lands directly in asset valuations and, through them, in executive scorecards for real-estate-exposed businesses.

    Designing the incentive structure

    A resilient architecture balances the annual plan against the long-term plan, and leading indicators against lagging ones.

    Short-term incentives (annual cash bonus) typically carry 10% to 15% of the total bonus pool for sustainability components, focused on near-term execution: data pipeline readiness, supplier onboarding, compliance milestones. Long-term incentives (performance share units) typically carry 15% to 25% of the multi-year grant, focused on cumulative decarbonization, portfolio transformation, and capital deployment over three-to-five-year cycles. Setting the overall sustainability allocation between 10% and 25% of variable pay gives the goals genuine weight without creating single-metric distortion.

    Indicator category Focus area & metric Practical target benchmark Incentive vehicle Verification standard
    Leading Vendor data integration & supply-chain mapping Onboard >80% of Tier-1 suppliers into the enterprise vendor carbon reporting system STI (annual bonus: 5–10% weight) ISO 14064-3 data audit & vendor portal system logs
    Leading Audit readiness & reporting frameworks Complete the CSRD double materiality matrix; align baseline disclosures with IFRS S1 and S2 STI (annual bonus: 5% weight) Independent legal & external auditor attestation
    Lagging Operational GHG emissions reduction Achieve a certified 6.5% annual reduction in combined Scope 1 and 2 emissions (1.5°C SBTi alignment) LTI (3-year PSU: 10–15% weight) Third-party limited / reasonable assurance (ISAE 3000)
    Lagging Real-estate energy intensity & fine avoidance Zero statutory fine exposure across holdings under NYC Local Law 97 ($268/ton penalty) LTI (3-year PSU: 5–10% weight) Certified Energy Star & engineering energy audit reports

    Executive Pay Design Worksheets & Bot Routines

    Align 2026 Executive Pay to Disclosure Floors & Proxy Rigor

    When proxy advisors grade your 2026 proxy statement, subjective or unearned sustainability payouts draw immediate Say-on-Pay scrutiny. Our printable 7-sheet Committee Pack provides the exact allocation models (10–15% STI / 15–25% LTI), formulaic 50/100/150% gates, and model clawback clauses required by compensation committees — or feed our $17 Bot Book to ChatGPT or Claude to stress-test your metrics for ISS/Glass Lewis recomputability, map CSRD GOV-3 and California SB 253/261 disclosure floors, and draft your CD&A proxy section automatically.

    ☑

    What’s In The Toolkit:

    • Allocation Worksheet: 10–15% STI / 15–25% LTI.
    • Gates Architecture: 50% / 100% / 150% formulaic cap.
    • 4-Metric Reference: Lineage logs & verification.
    • ISS / Glass Lewis Test: Recomputable outcome audit.
    • Regulatory Floor Map: CSRD GOV-3 & SB 253/261.
    • Clawback Clauses: ISAE 3000 assurance & restatement.
    • AI Bot Book ($17): 5 prompt routines + router.
    Instant download after checkout • Printable PDF & Bot-ready text

    Committee responsibilities and anti-greenwashing safeguards

    Clear governance boundaries keep the design honest. The Compensation Committee holds primary jurisdiction over incentive plan design, weightings, threshold approvals, metric calculation formulas, clawback enforcement, and final payouts. The Sustainability & Governance Committee oversees materiality determinations, evaluates carbon accounting methodologies, recommends metrics aligned to the corporate risk register, and monitors regulatory developments.

    Three structural safeguards protect the board from enforcement and litigation exposure:

    1. Mandatory third-party verification before payout. No variable pay linked to ESG performance vests or pays out without prior independent assurance (ISAE 3000 or ISO 14064-3) from a certified external auditor.
    2. Clawback and malus provisions. Agreements carry explicit recovery triggers: vested payouts can be clawed back and unvested grants cancelled if carbon accounting data is restated, found fraudulent, or if regulatory non-compliance penalties arise from executive oversight failures.
    3. An auditable data trail. Reporting systems maintain verifiable lineage from primary operational data — utility bills, facility meters, supplier disclosures — directly to the executive scorecard metrics.

    Sector benchmarks

    Incentive metrics must reflect each sector’s operational reality. Commercial real estate: portfolio energy use intensity reductions, Energy Star certification targets, GRESB standing, and eliminating municipal penalty exposure such as Local Law 97 fines. Enterprise and technology: renewable power purchase agreement execution, Scope 3 supply-chain decarbonization, data-center power usage effectiveness, and ISSB IFRS S1/S2 disclosure readiness. Consumer brands and retail: sustainable packaging adoption, circular design metrics, and supplier carbon auditing, structured through the pay-alignment frameworks the beauty sector vertical in this series documents in detail.

    Compare 2026 ESG Executive Compensation Toolkits

    Choose the quick reference card, printable committee working pack, or machine-executable AI playbook that fits your board governance cycle:

    Free Field Summary

    ESG-Linked Pay Quick Card

    2-page field reference: condensed summary of STI/LTI weight bands, 50/100/150% gates, 4-metric benchmark table, and ISS/Glass Lewis disclosure criteria.

    FREE
    direct download
    • STI (10–15%) & LTI (15–25%) Allocation Bands
    • 10–25% Total Variable Pay Governance Floor
    • 50% Threshold / 100% Target / 150% Stretch Cap Grid
    • 4-Metric Reference Table (Leading vs Lagging)
    • ISS & Glass Lewis 4-Pillar Disclosure Audit Test
    • CSRD GOV-3, SB 253/261 & Local Law 97 Overview
    • Five-Step 2026 Board Governance Roadmap Timeline

    Download Free PDF

    Working Pack

    2026 Committee Pack

    Printable, fillable 7-sheet working pack with allocation models, performance gates grids, proxy checklists, and contract clawback clauses.

    $7.00
    one-time
    • Sheet 1: Executive Variable Pay Allocation Worksheet
    • Sheet 2: Formulaic 50 / 100 / 150 Payout Gates Grid
    • Sheet 3: 4-Metric Benchmark Reference & Lineage Log
    • Sheet 4: ISS & Glass Lewis Disclosure Defense Checklist
    • Sheet 5: Regulatory Disclosure Floor Checklist (CSRD/SB)
    • Sheet 6: Pre-Payout Verification & Clawback Clauses
    • Sheet 7: Sector Benchmark Table & 2026 Board Checklist

    Buy Committee Pack ($7) →

    AI Intensive
    Book for Bots

    Board Pay Bot Book

    Structured 7-page AI playbook for ChatGPT, Claude, and Gemini: 5 machine-executable governance routines + embedded command router.

    $17.00
    one-time
    • Routine 1: Proxy-Advisor Stress-Test (/audit-metrics)
    • Routine 2: Disclosure Floor Mapper (/map-floors)
    • Routine 3: STI/LTI Scorecard Architect (/architect-pay)
    • Routine 4: Clawback & Safeguard Integrator (/safeguard)
    • Routine 5: Q1-Q4 Board Roadmap Runner (/run-roadmap)
    • Embedded Command Router & Session Diagnostics
    • Full Governance Dossier & CD&A Proxy Text Generator

    Buy Bot Book ($17) →

    The 2026 board roadmap: five steps

    1. Materiality audit & baseline (Q1). Run the double materiality review, identify the core ESG risks, and establish audited base-year data for every target metric — data integrity before target-setting.
    2. Framework & weighting design (Q2). Set the STI/LTI allocation (10–15% short-term, 15–25% long-term), and define threshold (50% payout), target (100%), and stretch (150% cap) gates for each metric.
    3. Safeguards & clawback integration (Q3). Draft clawback, malus, and data-restatement clauses into the compensation agreements; require third-party verification (ISAE 3000) before any bonus authorization.
    4. Proxy disclosure & investor engagement (Q4). Draft the Compensation Discussion and Analysis for the annual proxy statement (DEF 14A) and engage major institutional investors and proxy advisory teams on the metric selection logic — before the vote, not after.
    5. Post-cycle verification & certification (year-end). Receive the assurance reports, have the Compensation Committee certify achievement against the disclosed design, apply any documented discretion, and authorize vesting.

    Built this way, an ESG-linked pay plan is defensible on the only ground that ultimately matters: the metrics were stated in advance, measured independently, and paid exactly as disclosed.

    Updated Nov 1, 2026 — added the free ESG-linked pay quick card, ESG-linked pay committee pack, and board pay bot book downloads to this guide.

  • CSRD Double Materiality for Real Estate: A Portfolio Implementation Guide

    CSRD Double Materiality for Real Estate: A Portfolio Implementation Guide

    Updated Nov 1, 2026 — added the free double materiality quick card, CSRD portfolio pack, and double materiality copilot downloads to this guide.

    Double materiality is where CSRD stops being a reporting exercise and becomes an underwriting input — and nowhere is that truer than in real estate. A building portfolio feels both lenses physically: impact materiality (inside-out) runs through emissions, construction waste, tenant health and the communities around each asset; financial materiality (outside-in) runs through net operating income, valuations, insurance and the cost of debt. Our CSRD compliance roadmap maps the directive’s scope and timelines after the 2026 Omnibus. This guide is the sector build that sits under it: how an asset manager actually runs the double-materiality assessment across a portfolio, maps the ESRS topical standards to property operations, solves the tenant-data problem, and arrives at disclosures that survive limited assurance.

    Instant Portfolio Implementation Downloads

    Operationalize CSRD Double Materiality Across Your Portfolio

    Field quick-reference cards, fillable calibration packs, and AI-run interrogation routines built directly from this guide to set defensible thresholds, solve tenant data gaps, and survive limited assurance.

    Field Quick Card
    FREE

    Double Materiality Quick Card

    2-page field card: The two lenses applied to buildings (inside-out impact vs. outside-in financial) plus the 5-point threshold calibration test and ESRS real estate map condensed onto one card.

    Download Free PDF

    Direct download • No email gate

    Working Field Pack
    $7

    CSRD Portfolio Pack

    Printable/fillable 7-page kit: 5-point threshold calibration sheet, ESRS topical matrix with Working metrics, physical transmission checklist, transition regulatory map, tenant 4-tier tracker, CapEx memo template, and 12-month runway planner.

    Get Portfolio Pack ($7) →

    Instant checkout • Square verified

    AI Intensive
    Book for Bots
    $17

    Double Materiality Copilot

    Feed to ChatGPT or Claude: 7-page executable prompt playbook running 5 AI routines (Threshold Setter, ESRS Portfolio Mapper, Tenant Data Auditor, Stranding & Valuation Underwriter, Assurance Lineage Tester) + embedded router.

    Get Copilot Book ($17) →

    Software made of words • Instant delivery

    The two lenses, applied to buildings

    Impact materiality asks what the portfolio does to people and the environment, across acquisition, development, management and tenant operations. Under ESRS 1, a negative impact is scored on severity — scale, scope and irremediable character — and, for potential impacts, likelihood, across short (1 year), medium (2–5 year) and long (up to 30 years for property) horizons.

    Financial materiality asks what sustainability developments do to the asset manager: the plausible variance in NOI, property valuations and NAV, required CapEx, insurance premiums and borrowing margins, weighted by probability over the same horizons. In real estate the two lenses share evidence — the same flood model that scores an impact scores a valuation haircut — which is why the assessment belongs in the investment process rather than beside it.

    Thresholds are yours to set and defend. ESRS prescribes the method, not a numeric cut-off. Many managers calibrate on a 5-point scale and treat topics scoring high on either lens as material; whatever boundary you choose, document it, apply it consistently, and expect the assurance provider to test topics that fell just below it.

    The ESRS map for a property portfolio

    Standard Impact focus (inside-out) Financial focus (outside-in) Working metrics
    E1 Climate Scope 1–2 emissions; Scope 3 from tenant energy and embodied carbon in construction Stranding under decarbonisation pathways (CRREM); physical-event depreciation; retrofit CapEx tCO₂e/m²/yr; CRREM stranding year per asset
    E2 Pollution Construction/maintenance runoff; VOCs and indoor air quality Remediation liabilities; fines; tenant-retention effects of poor IAQ Hazardous-material area (m²); PM2.5 / VOC monitoring
    E3 Water Consumption intensity; cooling-tower loss; stormwater discharge Utility cost escalation; drought restrictions on cooling m³/m²/yr; % water recycled
    E4 Biodiversity Greenfield land take; habitat disruption; urban heat island Permitting delay; offset obligations; constrained land pipeline % of portfolio in biodiversity-sensitive zones
    E5 Circular economy Construction and fit-out waste to landfill; low component reuse Material price volatility; disposal costs; end-of-life value loss Waste diversion rate; % certified reusable/low-carbon materials
    S1 Own workforce Property-management health & safety; fair pay Compensation liabilities; delay costs from incidents and labour shortage Lost-time injury frequency; pay-gap reporting
    S2 Value-chain workers Construction and contracted-services labour practices Contractor litigation; supply-chain disruption Tier-1 contractor audit compliance; grievance cases
    S3 Affected communities Displacement pressure; construction disruption Planning objections and consenting delays Consultations held; objection counts
    S4 End-users (tenants) Indoor air quality, thermal comfort, accessibility, building safety Vacancy, default risk, renewal pricing pressure Tenant satisfaction; indoor environmental quality indices
    G1 Governance Anti-bribery in permitting; transparent tenant billing; ethical procurement Enforcement actions; capital-raising reputation Anti-corruption training coverage; substantiated whistleblowing cases

    Where the money moves

    Physical risk transmits in a straight line: acute hazards (flood, storm, wildfire) and chronic stressors (heat, sea-level rise, water scarcity) damage the asset and interrupt operations; insurance reprices or withdraws; NOI falls while defensive CapEx rises; the capitalisation of a smaller, riskier income stream is a lower valuation. At the end of that line sit the two terminal states this site’s stranded-assets analysis works through in detail — assets whose protective CapEx exceeds their discounted cash flow, and assets the insurance market will no longer carry at any economic price.

    Transition risk is increasingly statutory. The recast Energy Performance of Buildings Directive (EU) 2024/1275 requires member states to renovate the worst-performing slice of the non-residential stock — 16% by 2030 and 26% by 2033 — with residential trajectories alongside; how leasing consequences attach is set nationally. Outside Europe the same logic arrives as direct carbon penalties: New York’s LL97 charges $268 per tonne over a building’s limit, with a good-faith mitigation path for owners who can document progress — the mechanics are in our fines calculator and DC BEPS pathways pieces. California’s SB 253/261 regime adds the disclosure layer for large operators — see the compliance playbook. A portfolio materiality assessment that ignores the regulatory map of each asset’s jurisdiction is scoring the wrong future.

    The tenant data problem

    For most portfolios, Scope 3 is the footprint — tenant energy use and embodied carbon in construction and fit-outs are commonly cited in the 70–90% range of the total — and it is the data the landlord does not meter, does not buy and often has no contractual right to see. Working portfolios climb a four-level hierarchy:

    1. Direct automated data — smart meters and automated utility feeds for whole-building consumption.
    2. Tenant aggregated data — consolidated monthly consumption shared at building level, privacy preserved.
    3. Green-lease protocols — lease clauses that make utility disclosure a standing obligation, paired with shared reduction targets and cost-recovery terms agreed before anyone is in breach.
    4. Benchmark estimation — engineering proxies (CRREM pathways, CIBSE benchmarks) filling the gaps, flagged as estimates in the lineage, and retired asset by asset as metering arrives.

    The hierarchy is also the assurance strategy: an auditor can accept a disclosed estimate with a documented method far more readily than a precise number with no provenance.

    Portfolio DMA & Scope 3 Toolkit

    Solve the Tenant Scope 3 Data Problem and Defend Limited Assurance

    Tenant energy consumption represents 70–90% of a property portfolio’s carbon footprint. Auditors do not demand immediate 100% smart-meter coverage — they demand a documented 4-level data hierarchy, defensible benchmark estimations, and auditable lineage. Whether you need printable hierarchy trackers and CapEx underwriting memo inserts, or an AI copilot to audit your lease clauses and map meter-to-XBRL provenance, equip your team with field-ready tools.

    ⚙

    What’s In The Portfolio Kit:

    • 5-Point Threshold Sheet: 1yr/2-5yr/30yr calibration.
    • ESRS Topical Matrix: E1-E5, S1-S4, G1 property metrics.
    • Transmission Chain: Hazard > Insurance > NOI > Valuation.
    • Jurisdiction Map: EPBD (16%/26%), LL97 ($268/t), BEPS.
    • Tenant Hierarchy: Automated > Aggregated > Lease > CRREM.
    • CapEx Memo Insert: Stranding year & funded plans.
    • Lineage Log & Runway: Months 1–12 XBRL roadmap.
    • Bot Copilot: 5 AI-run routines with embedded router ($17).
    Secure 1-Click Square Checkout

    Governance, lineage and assurance

    Wire the assessment into capital allocation, or it decorates a report nobody prices. The working pattern at serious platforms: every acquisition, disposition and major CapEx memo carries the asset’s double-materiality read — projected CRREM stranding year, required decarbonisation CapEx, physical-risk exposure — and assets scored high on transition risk arrive with a funded decarbonisation plan inside the underwriting, not as an appendix to it. Executive variable pay tied to verified portfolio emissions and energy-intensity outcomes (the mechanics our CRE program guide sets out) closes the loop between the assessment and behaviour.

    Assurance is a data-lineage test. CSRD reporting is subject to limited assurance, and what the assurance provider actually examines is provenance: raw meter readings and utility bills, through ingestion and validation, emission-factor application and pathway modelling, to the tagged disclosure — with version control, unit conversions and deviation sign-offs visible at each step. Reports are published in machine-readable form with Inline XBRL tagging of material metrics. Build the lineage as you collect, and the assurance engagement is a review; build it afterwards, and it is an excavation.

    A realistic 12-month runway: months 1–3, run the double-materiality assessment and secure investment-committee sign-off on thresholds; months 4–6, build the data architecture — automated ingestion, green-lease rollout, estimation models for the gaps; months 7–9, test controls with a mock assurance engagement and fix what it finds; months 10–12, produce the tagged report and take it through external limited assurance.

    Portfolio Product Comparison

    Compare Double Materiality Implementation Tiers

    Choose the operational tier that matches your portfolio’s reporting timeline and assurance readiness: quick reference card, printable working worksheets for asset managers, or an AI copilot to interrogate underwritings and trace data lineage.

    Field Summary

    Double Materiality Quick Card

    2-page field card condensing the two lenses, the 5-point threshold scale, and the real estate ESRS map onto one reference card.

    • Two-lens definition (Inside-Out Impact vs. Outside-In Financial)
    • 5-point threshold scale (severity, scope, irremediable, likelihood)
    • Real estate time horizons (1-yr, 2–5 yr, up to 30-yr property)
    • ESRS E1–E5, S1–S4, G1 core building metrics summary
    • Tenant Scope 3 4-level data hierarchy quick glance
    • Limited assurance test criteria for just-below topics

    FREE

    Download Quick Card (PDF)

    Instant direct download • No email gate

    Static Working Pack

    CSRD Portfolio Pack

    7-page printable & fillable operational toolkit for asset managers, investment committees, and ESG controllers.

    • 5-point threshold calibration sheet (scale, scope, irremediable)
    • ESRS E1–E5, S1–S4, G1 matrix with Working metrics
    • Physical transmission checklist (hazard > insurance > NOI > haircut)
    • Transition jurisdiction worksheet (EPBD, LL97, BEPS, SB 253/261)
    • Tenant-data 4-level hierarchy tracker & estimation flags
    • CapEx memo insert & funded decarbonisation plan template
    • Limited-assurance lineage log & 12-month runway planner
    • Signoff block for investment committee approval

    $7.00

    Get Portfolio Pack ($7) →

    Instant checkout • Square verified • Instant delivery

    AI Intensive
    Book for Bots

    Double Materiality Copilot

    7-page executable AI workbook: feed directly into ChatGPT or Claude to run interactive portfolio double materiality audits and disclosures.

    • Threshold Setter Interview (/threshold-setter): 5-point calibration
    • ESRS Portfolio Mapper (/esrs-mapper): E1–G1 topical mapping & flags
    • Tenant Hierarchy Auditor (/tenant-hierarchy): Leases, clauses & proxy retirement
    • Stranding & Valuation Underwriter (/stranding-underwriter): CRREM & terminal states
    • Assurance Lineage Tester (/assurance-tester): Meter-to-XBRL provenance check
    • Embedded Output Router: “Software made of words” runtime engine

    $17.00

    Get AI Copilot Book ($17) →

    Instant checkout • Square verified • Instant delivery

    Frequently asked questions

    After the Omnibus, is a mid-size asset manager even in CSRD scope?

    Possibly not directly — Omnibus I narrowed direct scope substantially, and our roadmap piece tracks the current thresholds and waves. But double materiality reaches most serious managers anyway: through in-scope funds and parent groups, through lender and investor diligence, and through the EPBD and national building regimes that apply asset by asset regardless of the manager’s reporting status. The methodology is the durable asset; scope is a moving boundary.

    Is CRREM mandatory under ESRS?

    No. ESRS E1 requires a transition plan and emissions disclosure; it does not name a pathway tool. CRREM is the sector’s standard decarbonisation-pathway framework — the stranding-year analysis assurance providers and lenders most readily recognise — which makes it the pragmatic default rather than a legal requirement.

    Do tenant emissions really belong in the landlord’s report?

    Yes, where material: energy used by tenants in leased space sits in the landlord’s Scope 3 (downstream leased assets), and for most portfolios it is the largest single block. Estimation is permitted — what is not defensible is omitting the category because metering is incomplete. Disclose the hierarchy level each asset’s data comes from.

    Limited or reasonable assurance — which should we prepare for?

    Limited assurance is the operative standard, and as amended by Omnibus I the regime stays there — the earlier planned escalation to reasonable assurance was removed. Prepare for limited assurance done properly: tested controls, traceable lineage, documented judgements. That preparation also happens to be most of what reasonable assurance would have demanded.


    Sources: ESRS 1 (General Requirements) double-materiality method; Directive (EU) 2024/1275 (EPBD recast) — non-residential minimum performance trajectories (16% of worst-performing stock by 2030, 26% by 2033); CRREM decarbonisation pathways for real estate; NYC Local Law 97 / 1 RCNY 103-14 ($268/tCO₂e); CSRD as amended by Omnibus I (Directive (EU) 2026/470) — limited assurance retained, reasonable-assurance escalation removed. Companion pieces: BC ESG’s CSRD compliance roadmap, CRE ESG program guide, DC BEPS pathways, LL97 fines calculator and California SB 253/261 playbook.

  • Social Licence to Operate: FPIC, Grievance Systems and the Real Cost of Losing a Community

    Social Licence to Operate: FPIC, Grievance Systems and the Real Cost of Losing a Community

    Updated Nov 1, 2026 — added the free SLO quick card, social licence keeper pack, and SLO operating system downloads to this guide.

    No regulator issues a social licence, and no regulator can restore one — which is exactly why it behaves like the hardest permit in the portfolio. A social licence to operate (SLO) is the standing a project holds with the people who live with it: landowners, municipalities, Indigenous nations, local businesses. It is granted continuously or withdrawn suddenly, and its withdrawal has a measured price. The canonical study of company–community conflict in the extractive sector (Davis & Franks, 2014) found that a major mining project in the US$3–5 billion capital class loses roughly US$20 million per week of delayed production in net-present-value terms when community conflict stops work — and recorded one company attributing more than US$6 billion over two years to non-technical risks. This guide sets out the operating system serious projects now run to keep the licence: live stakeholder mapping, FPIC done as a lifecycle rather than an event, grievance mechanisms built to the UN’s effectiveness criteria, environmental-justice integration, and metrics a board can audit.

    Instant Governance & Community Toolkit

    Master FPIC Protocols, Grievance Escalation & SLO Governance

    Field-tested stakeholder maps, UNGP Principle 31 effectiveness scorecards, 4-tier escalation clock logs, benefit-sharing calculators, and bot-ready AI operating systems built directly from this guide.

    Quick Reference
    FREE

    SLO Quick Card

    2-page field card: The five stakeholder groups with risk vectors, the model 4-tier grievance escalation ladder with target clocks (48–72h to ~14d), and the operator licence KPI matrix condensed onto one reference card.

    Download Free PDF

    Direct download • No email gate

    Working Pack
    $7

    Social Licence Keeper Pack

    Printable/fillable 7-page working pack: Stakeholder map with dynamic re-score log, FPIC 5-phase lifecycle checklist & validity tests sheet, UNGP Principle 31 8-criteria effectiveness scorecard, 4-tier grievance ladder with clock log, SLO KPI tracker, and 90-day start checklist.

    Get Keeper Pack ($7) →

    Instant checkout • Square verified

    AI Intensive
    Book for Bots
    $17

    SLO Operating System for AI

    Feed to ChatGPT or Claude: 8-page executable prompt playbook with 6 interactive AI routines (Stakeholder Mapper & Early-Warning Audit, FPIC Lifecycle Interview, Grievance Doctor, EJ & Benefit-Sharing Builder, Board Dashboard Generator, 90-Day Planner) plus embedded router.

    Get AI Operating System ($17) →

    Software made of words • Instant delivery

    Why the licence hardened

    Finance made it a covenant. Under the Equator Principles (EP4, followed by more than 120 financial institutions), project finance is assessed against the IFC Performance Standards — including Performance Standard 7’s requirement of Free, Prior and Informed Consent (FPIC) in defined circumstances affecting Indigenous Peoples. No FPIC process, no disbursement. IFC’s own Sustainability Framework is under review through roughly 2028, which means the expectations underneath those covenants are being rewritten in public — watch that process, not the rumour mill.

    Due-diligence law is coming — later, and narrower, than the headlines said. The EU’s CSDDD, as amended by Omnibus I (Directive (EU) 2026/470), now covers only very large companies (over 5,000 employees and €1.5 billion in net worldwide turnover) and applies from July 26, 2029. The harmonised EU civil-liability regime was removed. But the near-term force on projects is real anyway: in-scope buyers, lenders and public tenders are already flowing due-diligence and grievance-handling expectations down through contracts to operators well outside the directive’s direct scope.

    Disclosure pulls the rest. Under IFRS S1, social friction that is material — land-access disputes, stoppages, consent failures — belongs in investor-grade disclosure with the same discipline as any other enterprise risk. A licence problem that reaches the financial statements has, by definition, been visible on the ground for months. The gap between those two moments is what an SLO system exists to close.

    Map stakeholders like they move — because they do

    A static stakeholder register is obsolete the month it is printed. Working systems classify stakeholders by risk vector, influence and vulnerability, and re-score as the project and the community change:

    Stakeholder Primary risk vectors Influence Vulnerability Engagement mechanism
    Indigenous & tribal leadership Land rights, cultural heritage, water High High Formal FPIC protocols; binding benefit-sharing agreements
    Directly impacted landowners Devaluation, eminent domain, displacement Medium-high High Bilateral negotiation; independent valuation; compensation panels
    Local community & municipalities Traffic, dust, noise, service strain Medium Medium Town halls; liaison committees; local hiring commitments
    Regional environmental NGOs Biodiversity, cumulative impacts High Low-medium Technical workshops; open-data monitoring portals; third-party audits
    Local businesses & contractors Economic exclusion, wage inflation Low-medium Medium Procurement forums; vendor training; local-content commitments

    Sentiment tracking turns the map into an early-warning system. Mature operators combine three feeds: automated monitoring of hyper-local channels (community forums, municipal minutes, local media) rolled into a periodic sentiment index; structured field logs from community liaison officers, GIS-tagged so micro-grievances are visible before they organise; and threshold alerts that route a spiking topic — water quality, haul-road safety — to operations while it is still a topic and not yet a blockade. Treat any sentiment index as an internal instrument: its value is in the trend and the methodology’s consistency, not in the absolute number.

    FPIC is a lifecycle, not a signature

    Free, Prior and Informed Consent — anchored in UNDRIP (notably Article 32, on projects affecting Indigenous lands and resources) and operationalised for financed projects through IFC PS7 — runs in five phases:

    1. Initiation & trust-building — engagement before permit applications, on the community’s timetable.
    2. Participatory impact & heritage scoping — joint baseline studies that admit Indigenous knowledge as evidence, not colour.
    3. Deliberation & autonomous decision-making — the community’s own governance decides, uncoerced, including the right to say no or to set conditions.
    4. Binding agreement — an enforceable Impact-Benefit Agreement recording what was consented to, and what was not.
    5. Lifecycle monitoring & joint governance — co-management oversight and periodic re-validation; consent for a changed project is a new question.

    The validity tests are in the name: free (no coercion, intimidation or engineered division), prior (before authorisation, with real time for internal decision processes), informed (complete, independent, culturally appropriate disclosure in the community’s language), and consent (a collective decision through the people’s own mechanisms — including withholding it).

    Grievance mechanisms: the early-warning system with UN criteria

    An operational-level grievance mechanism (OGM) earns its keep when it resolves a dust complaint in 48 hours instead of letting it become the affidavit in an injunction. The benchmark is Principle 31 of the UN Guiding Principles on Business and Human Rights — eight effectiveness criteria: legitimate, accessible, predictable, equitable, transparent, rights-compatible, a source of continuous learning, and based on engagement and dialogue. A mechanism missing any one fails predictably: inaccessible mechanisms learn about grievances from journalists; unpredictable ones teach people that escalation works better than filing.

    A model escalation ladder, with target clocks an operator sets and then reports against:

    Tier Trigger Target clock Owner Tool
    1 — Operational Nuisance: dust, noise, traffic, minor damage 48–72 hours Community liaison officer Field remediation; direct compensation
    2 — Systemic Baseline deviation; water-access concern; contracting dispute ~14 business days Operations director + social performance lead Joint investigation; facilitated mediation
    3 — Strategic Land ownership; cultural-site impact; systemic health concern 30–45 days Executive steering committee + independent ombudsman Arbitration; third-party review; agreement renegotiation
    4 — External Unresolved fundamental-rights claims External mandate Board committee + counsel Judicial or international forum

    Operational Social Licence Toolkit

    Resolve Community Friction Before It Becomes a US$20M/Week Production Stoppage

    Major capital projects lose roughly US$20 million per week when community conflict halts operations (Davis & Franks, 2014). Equator Principle covenants (IFRS S1, EP4 / IFC PS7) make Free, Prior and Informed Consent non-negotiable. Whether you need printable grievance intake registers and UNGP 31 scorecards for site liaison officers, or an autonomous AI operating system that audits dispute escalations and drafts benefit-sharing term sheets, equip your team with field-proven operating tools.

    ⚙

    What’s In The Field Toolkit:

    • 5 Stakeholder Maps: Risk vectors & re-scoring.
    • FPIC 5-Phase Lifecycle: Free/Prior/Informed audit.
    • UNGP 31 Scorecard: 8 effectiveness tests.
    • 4-Tier Escalation Ladder: 48–72h to ~14d SLA clocks.
    • SLO KPI Register: Velocity ≥95%, 0 stoppage days.
    • Benefit-Sharing Term Sheets: 5–15% equity, 25–40% spend.
    Secure 1-Click Square Checkout

    Environmental justice and benefit-sharing

    Environmental justice asks who carries the burden, cumulatively. A cumulative impact assessment stacks the project’s effects on top of the background a community already lives with — prior industry, health disparities, infrastructure deficits — using tools such as the US EPA’s EJScreen and community mapping, so mitigation lands where the burden is: filtration where water is the issue, health services where exposure is the issue, scrubbers where air is the issue.

    Benefit-sharing converts neighbours into stakeholders. Observed practice in negotiated agreements includes community or Indigenous-trust equity stakes in the project vehicle (often in the 5–15% range), local and Indigenous procurement commitments (commonly 25–40% of addressable spend), and legacy development funds taking a small share of revenue (commonly 0.5–2%) into independent community trusts that outlive the project. These are practice ranges from real agreements, not standards — but the direction is unambiguous: value that stays local is the strongest known predictor of a licence that survives contact with a bad quarter.

    Measure the licence like an operator

    KPI Type Method Example target
    Grievance resolution velocity Leading Resolved within SLA ÷ total received (OGM logs) ≥ 95% in SLA
    Unplanned community stoppage days Lagging Hours of disruption from protest, blockade or injunction Zero
    Local procurement retention Leading Certified local vendor spend ÷ tier-1 procurement spend ≥ 30%
    FPIC re-validation Leading Periodic audit of consent verification with Indigenous councils Full compliance
    Community sentiment trend Leading Consistent-methodology index over local channels Stable or improving trend
    Cumulative EJ exposure Leading GIS overlay of air/water/noise exposure on vulnerable zones No severe disparities unmitigated

    Targets are the operator’s own — set them, publish performance against them internally, and let the trend do the talking. The one non-negotiable is the lagging indicator: stoppage days are the licence rendered as a number, and they belong in the same enterprise risk dashboard as safety and downtime.

    Two patterns from the field

    The cases below are composites drawn from recurring project patterns; the structures are real practice, the specifics are illustrative.

    Water and consent in minerals. A critical-minerals project adjacent to Indigenous land in a water-stressed basin opened with top-down permitting that bypassed traditional councils — and met organised opposition centred on groundwater drawdown and a culturally significant landscape. The recovery pattern: pause the drilling programme, stand up a co-designed water and cultural heritage board with equal Indigenous representation, commit to high-recycling extraction technology verified by independent sensors on a public dashboard, and close an Impact-Benefit Agreement with a royalty stream to a tribal trust and substantial local-employment commitments. Consent was re-established through the community’s own process — on the order of a year, not a news cycle — and the project proceeded without stoppages.

    Easements without eminent domain. A long-distance transmission line crossing a dozen agricultural counties faced coordinated landowner resistance framed as a corporate land grab. The recovery pattern: replace one-time eminent-domain payments with voluntary landowner partnerships — annual compensation linked to the line’s use — re-route segments using landowner feedback to avoid sensitive parcels, and fund a county-level community investment vehicle for the services lines actually strain (emergency response, road maintenance). Easements were secured overwhelmingly voluntarily, and the model has since been reused for linear grid projects in the region.

    A 90-day start

    Days 1–30 — baseline. Audit the current social footprint and spatial EJ exposure; stand up a UNGP-criteria grievance mechanism at every operating site; instrument sentiment and liaison logging. Days 31–60 — governance. Formalise FPIC protocols for high-risk assets; agree benefit-sharing templates with counsel before a negotiation forces improvisation; charter a cross-functional social performance committee. Days 61–90 — integration. Feed the SLO KPIs into enterprise risk reporting; publish open-data environmental monitoring for host communities; train site leadership on the escalation ladder until the first real grievance arrives — because it will, and the response to grievance number one sets the community’s prior for every grievance after it.

    Social Licence Product Comparison

    Compare Social Licence Tools & AI Systems

    Choose the operational tier that matches your project’s phase and stakeholder risk profile: quick field reference card, printable working pack for field liaisons, or an AI operating system that audits mechanisms, runs FPIC interviews, and generates board disclosures.

    Field Summary

    SLO Quick Card

    2-page field card condensing the stakeholder archetypes, grievance ladder, and operator KPIs onto one reference sheet.

    • The 5 core stakeholder groups & primary risk vectors
    • 3-feed sentiment tracking & early-warning architecture
    • 4-tier grievance escalation ladder & target clocks
    • The 6 operator-grade licence KPIs & targets
    • FPIC 5-phase lifecycle & the 4 validity tests
    • Benefit-sharing observed practice ranges

    FREE

    Download Quick Card (PDF)

    Instant direct download • No email gate

    Static Working Pack

    Social Licence Keeper Pack

    7-page printable & fillable operational toolkit for community liaison leads, social performance directors, and site managers.

    • Stakeholder map worksheet with dynamic re-score log
    • FPIC 5-phase lifecycle checklist (UNDRIP Art 32 / IFC PS7)
    • Free, Prior, Informed, Consent validity audit matrix
    • UNGP Principle 31 8-criteria grievance scorecard
    • 4-tier grievance intake register with SLA clock tracking
    • Enterprise SLO KPI tracker (velocity ≥95%, stoppage days zero)
    • Benefit-sharing register (5–15% equity, 25–40% spend)
    • 90-day implementation action checklist & signoff block

    $7.00

    Get Keeper Pack ($7) →

    Instant checkout • Square verified • Instant delivery

    AI Intensive
    Book for Bots

    SLO Operating System for AI

    8-page executable AI workbook: feed directly into ChatGPT or Claude to run interactive social performance and grievance management routines.

    • Stakeholder Mapper & Early-Warning (/stakeholder): Archetype triage
    • FPIC Lifecycle Interview (/fpic-interview): 5-phase validity audit
    • Grievance Doctor (/grievance-doctor): UNGP 31 audit & tier triage
    • EJ & Benefit-Sharing Builder (/ej-benefit): Cumulative overlay & term sheets
    • Board-Ready SLO Dashboard (/slo-dashboard): Stoppage NPV & IFRS S1
    • 90-Day Implementation Planner (/90day-plan): Gantt milestone schedule
    • Embedded Output Router: “Software made of words” runtime engine

    $17.00

    Get AI Operating System ($17) →

    Instant checkout • Square verified • Instant delivery

    Frequently asked questions

    Is a social licence a legal requirement?

    Not under that name — no statute issues one. Its components increasingly are legal: FPIC duties bind financed projects through the Equator Principles and IFC PS7 and bind states under UNDRIP-derived frameworks; due-diligence and disclosure regimes (CSDDD from 2029, IFRS S1 materiality today) reach the same conduct from other directions. The licence is the practical precondition that lenders, insurers and boards now price.

    What does losing community support actually cost?

    The best-measured figure remains Davis & Franks (2014): roughly US$20 million per week of delayed production, in NPV terms, for a world-class mining project in the US$3–5 billion capital class — before security, legal, financing and write-down costs. Their interviewees added the cost companies most often overlook: senior management time, up to and including the CEO’s, diverted to conflict management.

    Can consent be withdrawn after it is given?

    In practice, yes — that is the point of the lifecycle model. Consent attaches to a defined project, scope and set of conditions; material changes reopen the question, and joint-governance structures with periodic re-validation exist precisely so withdrawal is a governed conversation rather than a blockade. Agreements that pretend consent is a one-time, perpetual signature tend to discover otherwise.

    What makes a grievance mechanism credible to a community?

    The UN Guiding Principles’ eight tests (Principle 31): it is legitimate, accessible, predictable, equitable, transparent, rights-compatible, a source of continuous learning, and designed through engagement with the people expected to use it. Publishing aggregate outcomes — volumes, categories, resolution times — is the transparency step most mechanisms skip and communities notice most.


    Sources: Davis, R. & Franks, D.M. (2014), “Costs of Company-Community Conflict in the Extractive Sector,” PNAS / Harvard Kennedy School CSR Initiative (US$20M per week, US$3–5B capital class; >US$6B two-year non-technical-risk attribution); UN Guiding Principles on Business and Human Rights, Principle 31; UNDRIP Art 32; IFC Performance Standard 7 and the IFC Sustainability Framework review (2024–2028); Equator Principles EP4; Directive (EU) 2026/470 (Omnibus I) amending the CSDDD — scope >5,000 employees and >€1.5B turnover, application July 26, 2029; IFRS S1. Benefit-sharing percentages are observed practice ranges from negotiated agreements, not regulatory standards; the two field cases are composites.

  • Responsible AI Meets ESG Reporting: The AI Act’s Real Timeline, Audit Metrics and Compute Accounting

    Responsible AI Meets ESG Reporting: The AI Act’s Real Timeline, Audit Metrics and Compute Accounting

    Updated Nov 1, 2026 — added the free AI Act timeline quick card, responsible AI + ESG evidence pack, and audit & accounting playbook downloads to this guide.

    AI governance and ESG reporting have merged into a single evidence problem. The sustainability report now has to describe how models are governed; the AI governance file now has to carry environmental numbers — energy per workload, water per facility, emissions per training run. In Europe both halves run on law: the EU AI Act (Regulation (EU) 2024/1689) supplies the governance machinery, and CSRD/ESRS plus the ISSB baseline supply the disclosure frame. What the regimes jointly demand is not policy prose but records: logs, metrics, lineage, incident clocks. This guide lays out the timeline as it actually stands after the 2026 Digital Omnibus moved it, the audit metrics that generate defensible evidence, and the compute accounting that connects AI to the E in ESG.

    Instant Governance & ESG Downloads

    Master Responsible AI & EU AI Act Governance

    Field-tested statutory timeline cards, Article 50 transparency checklists, Article 27 FRIA worksheets, AIR 0.80 bias audit logs, green compute calculators, and bot-ready compliance playbooks built directly from this guide.

    Quick Reference
    FREE

    AI Act Timeline Quick Card

    2-page field card: The amended statutory timeline on one card — Feb 2 2025, Aug 2 2025, Aug 2 2026 (Art. 50 + GPAI enforcement), Dec 2 2027 (Annex III high-risk), Aug 2 2028 (Annex I) plus the Dec 2026 grace note, each with what it switches on.

    Download Free PDF

    Direct download • No email gate

    Working Pack
    $7

    Responsible AI + ESG Evidence Pack

    Printable/fillable 7-page working pack: Amended timeline card, Art. 50 C2PA machine-readable marking log, Art. 27 FRIA worksheet, AIR 0.80 freeze rule log, 6-month WORM logs, <0.85 escalation circuit, Art. 73 incident clock drill sheet, and compute carbon worksheet.

    Get Evidence Pack ($7) →

    Instant checkout • Square verified

    AI Intensive
    Book for Bots
    $17

    AI Audit & Accounting Playbook

    Feed to ChatGPT or Claude: 8-page executable playbook with 6 interactive AI routines (Model Inventory Interview, Art. 50 Transparency Auditor, FRIA Scoping, Bias & Logging Audit, Incident Clock Drill, Compute Accounting Generator) plus embedded router.

    Get AI Playbook ($17) →

    Software made of words • Instant delivery

    The timeline, as amended

    Date What applies
    Feb 2, 2025 Prohibited practices banned; AI literacy duties live
    Aug 2, 2025 General-purpose AI (GPAI) model obligations apply
    Aug 2, 2026 Article 50 transparency applies — users told they are interacting with AI; synthetic content marked machine-readably. The Commission’s GPAI enforcement and fining powers also begin
    Dec 2, 2027 Annex III high-risk obligations — deferred 16 months by the Digital Omnibus on AI (Regulation (EU) 2026/1744, in force July 27, 2026)
    Aug 2, 2028 Annex I high-risk (AI inside regulated products) — also deferred by the Omnibus

    The Omnibus lesson generalises: dates move; substance doesn’t. The high-risk duties arriving in December 2027 are the same duties that were due in August 2026 — risk management (Art 9), data governance (Art 10), record-keeping (Art 12), human oversight (Art 14), post-market monitoring (Art 72). Organisations that read the deferral as a holiday will rebuild in a panic; organisations that read it as schedule relief will arrive with evidence that has already run in production. Note what did not move: Article 50 transparency is live now, and systems already on the market before August 2026 have only a short grace — to December 2026 — to bring content-marking into line.

    The governance skeleton

    Accountability. A cross-functional AI governance body (sustainability, AI engineering, security, legal) over a three-lines model: system owners in the first line log risk and lineage as they build; risk and compliance in the second line validate independently, set bias thresholds and own the model risk taxonomy; internal audit in the third line tests whether the controls work. A RACI per deployed model — production, fine-tuned and API-integrated alike — is the artefact that makes accountability inspectable rather than asserted.

    Risk classification and impact assessment. Every system is tiered against the Act’s categories (prohibited / high-risk / transparency / minimal). Fundamental Rights Impact Assessments (Art 27) are mandatory for specified deployer classes — public bodies and deployers of certain Annex III systems such as credit scoring and insurance pricing — and are sound practice well beyond that set. Threat modelling for AI-specific attacks (prompt injection, data poisoning, membership inference) belongs in the same file.

    Data governance. Lineage manifests that record origin, licence, consent attributes and transformations for training, fine-tuning and RAG corpora; automated scanning for personal data, copyrighted material and known bias patterns; and validation that synthetic data has not amplified the skew it was meant to dilute.

    Transparency. Article 50 executed technically, not rhetorically: machine-readable marking of synthetic outputs (C2PA content credentials are the working standard), interaction disclosure at the point of use, and model cards that state architecture, intended use, boundaries and known limitations.

    Human oversight. Human-in-the-loop approval for high-consequence decisions (credit, hiring screens, medical triage, tenancy decisions); human-on-the-loop monitoring with real override capability elsewhere; and — the part programmes skip — operator training and rotation designed against automation bias and fatigue, because an overseer who rubber-stamps is a control that exists only on paper.

    Post-market monitoring and the incident clock. Runtime telemetry on output distributions, drift and guardrail triggers; re-validation on defined drift thresholds; and an incident pipeline wired to Article 73’s tiered deadlines: report immediately once a causal link is established, and in any event within 15 days — 10 days where a death may have been caused, 2 days for widespread infringements or serious disruption of critical infrastructure. Those clocks ride with the high-risk regime, and they are days, not the 72 hours GDPR trained everyone to expect.

    Audit metrics: evidence, quantified

    Fairness metrics — with their anchors stated honestly. The Adverse Impact Ratio (selection rate of a protected subgroup ÷ selection rate of the benchmark group) carries the one genuinely regulatory threshold in this field: below 0.80 breaches the four-fifths rule from US employment practice and should freeze the workflow pending investigation. The other common metrics — equalized odds difference (working target ≤ 0.05), demographic parity difference (≤ 0.10), toxicity classifiers (a < 1% flag rate as an internal clean baseline) — are practitioner thresholds: defensible, widely used, and chosen by the operator rather than imposed by a regulator. An audit file that distinguishes the two kinds reads as credible; one that dresses internal targets as law does not.

    Logging — the substrate everything else stands on. For high-risk systems the Act’s record-keeping (Art 12, with deployer duties in Art 26) expects automatic event logs retained at least six months. A working log record carries: timestamp, model ID and exact version, prompt and response hashes, confidence scores, and guardrail flags. Retention on write-once storage is an implementation choice that earns its cost the first time a supervisor asks for an unaltered history.

    Escalation circuits. Low-confidence or guardrail-tripped outputs route to a human reviewer, and the review itself is logged — reviewer ID, decision, rationale code, response time. An illustrative trigger bound is a confidence score under 0.85; the number matters less than the property that the circuit is automatic, recorded and tested.

    Responsible AI + ESG Toolkit

    Bridge the Gap Between Responsible AI Governance and ESG Assurance

    AI compliance under the EU AI Act and corporate ESG assurance under CSRD ESRS E1/S1/G1 have merged into a single evidence problem. Regulators and external certifiers demand immutable WORM logs, verified C2PA provenance manifests, quantitative AIR 0.80 bias tests, and defensible Scope 2/3 compute accounting. Equip your compliance and risk teams with structured working sheets, incident response clocks, and bot-ready audit routines that calculate exact fine exposures and assurance-grade disclosures.

    ⚙

    What’s In The Evidence Toolkit:

    • Amended AI Act Timeline: Feb 2025 to Aug 2028.
    • Art. 50 Transparency & C2PA: Provenance marking log.
    • Art. 27 FRIA Scoping: Mandatory cases vs good practice.
    • AIR 0.80 Freeze Rule: Four-fifths bias threshold log.
    • 6-Month WORM Audit Logs: <0.85 escalation circuit.
    • Art. 73 Incident Drill: 15/10/2-day reporting clocks.
    • Green Compute Ledger: Operational & embodied carbon.
    Secure 1-Click Square Checkout

    The E pillar: compute accounting

    AI’s environmental ledger has two entries — the carbon embodied in hardware, and the carbon emitted running it — and ESG reporting increasingly wants both, at workload granularity.

    • Operational carbon = energy consumed (kWh) × grid emission factor (gCO₂e/kWh) × PUE. Location-based and market-based figures both belong in the file; they answer different questions.
    • Embodied carbon = the hardware’s manufacturing footprint amortised over the share of its lifespan a workload consumes — (production emissions) × (allocated compute hours ÷ total hardware life). GPUs, HBM and accelerators make this entry material for training-heavy estates.
    • Efficiency units make the numbers governable: energy per training run, and for inference, kWh per 1M tokens (or per 1,000 queries). Efficient frontier systems operate in the region of 0.15 kWh per 1M tokens and below; treat that as a frontier marker for procurement conversations, not an industry average.
    • Facility multipliers: PUE at or below 1.2 is best-in-class hyperscale performance (industry averages sit nearer 1.5); WUE carries the water side — our data-center water guide sets out that method in full.

    Under CSRD this lands in ESRS E1 (energy and emissions) with water in ESRS E3; under the ISSB baseline it enters through S1/S2 materiality. Either way, the telemetry pipeline is the same one the AI Act’s monitoring duties require — build it once, report it twice. And the emissions accounting discipline is the same one our Scope 3 guide applies to vendors: AI compute bought from cloud providers is a purchased service, and its data quality will be graded like everyone else’s.

    One programme, three frameworks

    Dimension EU AI Act ISO/IEC 42001:2023 NIST AI RMF Evidence
    Governance & policy Arts 9, 50 Clauses 5–6; Annex A.2–A.3 Govern Board minutes; AI policy; RACI
    Risk & impact Arts 9, 27 (FRIA) Clause 6.1; Annex A.5 Map, Measure FRIAs; threat models; risk register
    Data & bias Art 10 Annex A.7 Map, Measure Lineage manifests; AIR reports; consent logs
    Transparency Art 50 Annex A.8 Manage C2PA marking logs; model cards; disclosure UX
    Logging & monitoring Arts 12, 72 Clause 9; Annex A.9 Measure, Manage ≥6-month logs; drift telemetry; HITL records
    Compute & ESG ESRS E1/E3 alignment Clause 8; Annex A.6 Govern, Measure Emissions logs; WUE/PUE reporting

    The roadmap to December 2027

    Now — scope and classify. Inventory every model: in-house, fine-tuned, vendor API, embedded feature. Tier each against the Act; register the Article 50 population (already live); gap-analyse against ISO 42001 and the NIST framework. Through 2027 — build the evidence machinery. WORM-retained logging, continuous bias evaluation, HITL circuits, and the compute telemetry feed into sustainability reporting. Before December 2, 2027 — high-risk readiness. Technical documentation suites, FRIAs, quality management, and a mock conformity assessment with an external body while mistakes are still cheap. The Omnibus bought sixteen months; the programmes that use them as build time will experience the deadline as a filing exercise. The ones that don’t will experience it as an incident.

    Responsible AI & ESG Product Comparison

    Compare Governance Tools & AI Audit Systems

    Choose the operational tier that matches your organization’s regulatory readiness and audit posture: quick statutory timeline reference, printable/fillable evidence logs, or an autonomous AI playbook that runs interviews, tests thresholds, and generates audit dossiers.

    Field Summary

    AI Act Timeline Quick Card

    2-page field card condensing the amended EU AI Act statutory calendar onto one reference sheet.

    • Feb 2, 2025: Art. 5 prohibited AI bans & Art. 4 literacy
    • Aug 2, 2025: GPAI governance rules & codes of practice
    • Aug 2, 2026: Art. 50 transparency & GPAI enforcement
    • Dec 2, 2027: Annex III standalone high-risk systems
    • Aug 2, 2028: Annex I harmonized product safety systems
    • Dec 2026 GPAI transition grace period note

    FREE

    Download Quick Card (PDF)

    Instant direct download • No email gate

    Static Working Pack

    Responsible AI + ESG Evidence Pack

    7-page printable & fillable operational toolkit for compliance directors, risk leads, and ESG assurance controllers.

    • Amended AI Act timeline card with statutory milestones
    • Art. 50 transparency checklist & C2PA machine-marking log
    • Art. 27 FRIA scoping worksheet (credit, insurance, public bodies)
    • Bias & logging evidence log (AIR 0.80 freeze rule)
    • Equalized odds ≤0.05 & demographic parity ≤0.10 logs
    • 6-month WORM audit log fields & <0.85 escalation circuit
    • Art. 73 incident clock drill sheet (15/10/2-day clocks)
    • Compute carbon accounting worksheet (ESRS E1/E3 mapping)

    $7.00

    Get Working Pack ($7) →

    Instant checkout • Square verified • Instant delivery

    AI Intensive
    Book for Bots

    AI Audit & Accounting Playbook

    8-page executable AI workbook: feed directly into ChatGPT or Claude to run interactive AI governance and ESG assurance workflows.

    • Model Inventory & Tiering Interview (/inventory): Art. 5, Annex III/I
    • Art. 50 Transparency Auditor (/transparency): C2PA & watermarking
    • FRIA Scoping Walkthrough (/fria): Art. 27 mandatory test suite
    • Bias & Logging Audit (/bias-audit): AIR 0.80, EqOdds, WORM trails
    • Incident Clock Drill (/incident-drill): Art. 73 tabletop clocks
    • Compute Accounting Generator (/compute-esg): ESRS E1/E3 ledger
    • Embedded Command Router: Instant execution switches for your bot

    $17.00

    Get AI Playbook ($17) →

    Software made of words • Instant delivery

    Frequently asked questions

    Did the Digital Omnibus cancel the AI Act’s high-risk duties?

    No — it moved them. Regulation (EU) 2026/1744 deferred Annex III standalone high-risk obligations to December 2, 2027 and Annex I embedded systems to August 2, 2028. The substantive obligations are unchanged, Article 50 transparency was not deferred, and GPAI duties have applied since August 2025.

    How fast must a serious AI incident be reported?

    Under Article 73: immediately once a causal link (or its reasonable likelihood) is established, and no later than 15 days after awareness — 10 days where a death may have been caused, and 2 days for widespread infringements or serious, irreversible disruption of critical infrastructure. An incomplete initial report is permitted, with supplements to follow.

    Is a Fundamental Rights Impact Assessment required for every model?

    No. Article 27 mandates FRIAs for specified deployers — public-law bodies and deployers of particular Annex III systems (notably creditworthiness evaluation and life/health insurance pricing). Running them more broadly is good practice; claiming the Act requires them universally is not accurate.

    Do we have to disclose the energy our AI uses?

    If you are in CSRD scope, energy and emissions data — including material compute — belongs in ESRS E1 reporting; ISSB reporters reach the same place through materiality. Even out of scope, the procurement direction is clear: enterprise customers increasingly demand per-workload energy and emissions figures from AI vendors, and the vendors who can produce them win the diligence round.


    Sources: Regulation (EU) 2024/1689 (EU AI Act), Arts 9, 10, 12, 14, 26, 27, 50, 55, 72, 73; Regulation (EU) 2026/1744 (Digital Omnibus on AI), OJ July 24, 2026 — Annex III to Dec 2, 2027, Annex I to Aug 2, 2028; European Commission draft guidance on serious-incident reporting (Sep 2025) and law-firm analyses (Latham & Watkins; Paul Weiss); ISO/IEC 42001:2023; NIST AI RMF 1.0 and NIST AI 600-1 (GenAI Profile); EEOC Uniform Guidelines four-fifths rule; ESRS E1 and E3. Thresholds identified as practitioner targets are operator-chosen benchmarks, not regulatory requirements.

  • Physical Climate Risk for Manufacturing Assets: Hazard Mapping, Expected-Loss Valuation and Tier-N Supply Chains

    Physical Climate Risk for Manufacturing Assets: Hazard Mapping, Expected-Loss Valuation and Tier-N Supply Chains

    Updated Nov 1, 2026 — added the free physical risk quick card, manufacturing audit pack, and climate risk operator downloads to this guide.

    Physical climate risk work has moved from coloured maps to auditable numbers. Screening a portfolio in broad regional bands no longer satisfies IFRS S2, ESRS E1 or California’s SB 261 — nor a lender, an insurer or an acquirer doing diligence. What replaced it is an asset-level method: hyper-local hazard data at the facility’s coordinates, vulnerability assessed against the specific processes inside the fence, and the results carried into valuation as expected losses rather than as narrative. This guide sets out that method for manufacturing portfolios — the hazard taxonomy, the expected-annual-loss architecture, the business-interruption arithmetic, and the tier-N supply-chain mapping where most of the real exposure hides. (Two companions: physical risk for data centers, and the insurance-to-write-down pathway in our stranded-assets guide.)

    Instant Manufacturing Risk Downloads

    Physical Climate Risk for Manufacturing: Quick Card, Audit Pack & AI Operator

    Auditable 0.05° hazard screening grids, catastrophe-modeling EAL DCF worksheets, WACC no-double-count protocols, and machine-executable AI bot playbooks built directly from published asset-level engineering standards.

    Quick Reference
    FREE

    Physical Risk Quick Card

    2-page field card: acute vs chronic hazard taxonomy, return-period damage mechanisms, and quick-reference threshold values (0.5m / 1.5m flood, low-30s°C Tw + 35°C limit, BWS >40% / >80%, 0.5–0.7%/°C turbine derate, 40°C dry-bulb) on one card.

    Download Free PDF

    Direct download • No email gate

    Working Pack
    $7

    Manufacturing Physical Risk Audit Pack

    5-sheet printable working pack: SSP horizon planner (2026–2060), 0.05° asset check, acute/chronic hazard register, EAL DCF valuation worksheet, WACC no-double-count audit, BI downtime calculator, and Tier-N cascade mapper.

    Get Audit Pack ($7) →

    Instant checkout • Square verified

    AI Intensive
    Book for Bots
    $17

    Manufacturing Climate Risk Operator

    Feed to ChatGPT or Claude: 8 AI-run routines (/horizon, /hazard, /chronic, /eal, /wacc-audit, /bi-calc, /insurance, /tier-n, /all) with embedded output router to screen coordinates, build EAL curves, test impairment, and trace supplier bottlenecks.

    Get Operator ($17) →

    Software made of words • Instant delivery

    The frame: scenarios and horizons

    Run the assessment on CMIP6 projections under three Shared Socioeconomic Pathways — SSP1-2.6, SSP2-4.5 and SSP5-8.5 — because each planning decision lives on a different clock:

    Horizon Window Decisions it informs
    Near term 2026–2030 Operating budgets, insurance placement, immediate supply-chain resilience
    Medium term 2031–2040 Mid-life plant upgrades, CapEx sequencing, supplier consolidation
    Long term 2041–2060 Useful-life and depreciation policy, greenfield siting, terminal value

    Hazard data must resolve to the asset — grid scales around 0.05° (≈5 km) are the working standard — because micro-geography decides outcomes: two plants in the same river basin can sit metres apart in elevation and categories apart in risk.

    The hazard taxonomy

    Acute hazards arrive as events; chronic stresses arrive as drift. Both belong in the same register.

    Acute. Pluvial and fluvial flooding — evaluated at 100- and 500-year return periods against depth thresholds that map to damage mechanisms (as working heuristics, ~0.5 m reaches electrical infrastructure; ~1.5 m begins displacing heavy equipment). Tropical cyclones and storm surge — Category 4/5 wind fields plus surge height against roof, cladding and outdoor-storage tolerances. Wildfire and smoke — WUI proximity for direct exposure, and particulate episodes for the indirect one: extreme smoke events force filtration and cleanroom responses well beyond the fire perimeter.

    Chronic. Wet-bulb heat — the combined heat-humidity measure that governs both human labour and evaporative cooling. Labour productivity falls steeply as wet-bulb temperatures climb through the low 30s °C; occupational work/rest regimes are specified in WBGT standards rather than wet-bulb directly, and 35°C wet-bulb stands as the physiological survivability limit for sustained exposure. Baseline water stress — the WRI Aqueduct ratio of withdrawals to renewable supply: High above 40%, Extremely High above 80%, with allocation caps and tariff escalation following the classification. Thermal efficiency degradation — the quiet tax: gas turbines lose roughly 0.5–0.7% of output per °C above their 15°C ISO rating, and chillers, cooling towers and steam systems derate on the same physics.

    Hazard Working metric Assets most exposed Mechanism
    Pluvial/fluvial flood Peak depth at 100-yr return Fabs, automotive assembly Sub-fab equipment inundation; cleanroom loss; short circuits
    Wet-bulb heat Consecutive days in low-30s °C Tw Heavy industry, textiles, outdoor refining Labour capacity loss; cooling-tower derating; electronics trips
    Water stress Aqueduct BWS (>80% = extreme) Pharma, wafer processing, beverages Intake rationing; recycling CapEx; output constraints
    Storm surge Surge height above MSL Coastal chemicals, port terminals Corrosion; tank displacement; logistics shutdown
    Thermal shift Days above 40°C dry-bulb Precision machinery, plastics Cooling energy surge; material warping; grid trips

    From hazard to value: expected annual loss

    The valuation bridge is the catastrophe-modelling identity: Expected Annual Loss = Σ over hazards of ∫ probability(h) × vulnerability(h) × exposed value. Probability comes from the hazard curves; vulnerability is the damage function for this asset type at that intensity (a cleanroom’s curve looks nothing like a warehouse’s); exposed value is replacement cost plus the gross margin the asset carries. EAL then enters the DCF where it belongs — as a deduction inside free cash flow, alongside the adaptation CapEx the risk justifies — and into terminal assumptions through shortened useful lives.

    One discipline separates credible practice from decoration: do not charge for the same risk twice. A common practitioner shortcut adds a blanket “climate premium” to WACC on top of EAL-adjusted cash flows. If expected losses already sit in the cash flows, a general discount-rate premium double-counts them; a premium is defensible only for the residual that cannot be modelled — and it should be argued as such, in the open, rather than applied as a band. Auditors probe this seam, and they are right to.

    Impairment follows the same evidence. Under IAS 36 and ASC 360, physical hazards are impairment indicators: chronic stress shortens useful lives (accelerating depreciation), recurring events can strand a facility outright where retrofit cost exceeds remaining discounted cash flows, and the recoverable-amount test prices what is left. The mechanics are in the companion guide; the manufacturing-specific point is that the inputs — EAL curves, derating schedules, water rationing scenarios — are engineering artefacts, and the audit file should contain them, not summaries of them.

    EHS, Finance & Valuation Tools

    Model Asset-Level Expected Losses & Defend Your WACC Against Audit Scrutiny

    The catastrophe-modelling identity (EAL = Σ ∫ probability × vulnerability × exposed value) bridges asset-level hazard curves directly into free cash flows and IAS 36 / ASC 360 impairment tests. But applying a blanket “climate premium” to WACC on top of EAL cash-flow deductions double-counts the same risk — a primary red flag for external auditors and valuation committees. Use our printable 5-sheet working pack to model asset-level EAL curves and document residual-only discount rate adjustments, or deploy the AI Climate Risk Operator to automate hyper-local coordinate screening, DCF cash-flow integration, and audit-file generation.

    ☑

    What’s In The Toolkit:

    • 0.05° Grid Screener: Hyper-local asset coordinates.
    • EAL Valuation Table: Prob × vuln × exposed value into DCF.
    • WACC Double-Count Audit: Cash flow vs residual discount.
    • IAS 36 / ASC 360 Sheet: Impairment & useful-life triggers.
    • BI Arithmetic Sheet: Downtime days & spot surge costs.
    • 3-Layer Insurance Sizer: Parametric, property & tail reserve.
    • AI Bot Book ($17): 8 AI routines + prompt router.
    Secure 1-Click Square Checkout

    Business interruption: the larger number

    Structural damage is usually the smaller loss; downtime is the larger. Working form: BI exposure = (downtime days × daily fixed costs) + (lost units × unit margin) + surge costs. Surge costs are where inexperienced models fail: spot electricity during scarcity events can multiply several-fold (ERCOT-style pricing makes the arithmetic vivid), emergency water arrives by tanker at punitive rates, and air-freight premiums replace every weather-broken shipping leg at once. A facility can be physically untouched by a regional event and still post its worst quarter of the decade through this line alone.

    Insurance layering for what remains

    As carriers reprice or exit (the retraction mechanics are detailed in the stranded-assets guide), industrial portfolios increasingly carry risk in three layers. Parametric cover takes the fast-liquidity slice — payouts on objective triggers, typically within weeks, no adjustment process. Traditional property/BI programmes carry the insurable core, at repriced terms. The residual — risks no market will write — goes to an enterprise self-insurance reserve, sized off tail loss (a common formulation: the high-percentile expected tail loss minus maximum commercial payouts). That reserve is real capital standing idle against weather, which is why it belongs in the valuation conversation and not only the insurance one: it is a cash drag with a climate cause, and Phase-gated adaptation spending is how it shrinks.

    Tier-N: where the cascade starts

    Owned-asset analysis is the smaller half of manufacturing exposure. The 2011 Chao Phraya floods remain the canonical lesson: Thai industrial estates inundated, the global hard-drive industry — concentrated there — short for quarters, and OEMs on other continents stopped by a component they did not know was geographic. Map the tiers with the same hazard screen as owned assets:

    Node Hazard Bottleneck Mitigation
    Wafer fabrication (tier 2/3) Water stress, heat Continuous ultra-pure water demand — millions of gallons a day for a large fab; intake cuts force throttling fast Closed-loop recycling; dual-region supplier qualification
    Specialty polymers (tier 1) Gulf Coast hurricanes Single-source precursor and resin capacity — the 2021 Texas freeze idled resin production for months Safety stock (~60 days on critical grades); alternate synthesis agreements
    Barge freight Low river water Rhine/Mississippi draft limits — low water at critical gauges can halve barge loads or worse Dynamic modal-shift contracts; secondary-hub inventory
    Port terminals Storm surge, wind Cranes suspend operations well below hurricane-force winds; multi-day closures queue vessels for weeks Port diversification; pre-negotiated off-dock storage

    The recurring structure: concentration that was purchased as efficiency reprices as fragility. Dual-sourcing, buffer stock and modal-shift contracts all cost money in ordinary years — the EAL framework is what lets a company show, in numbers a CFO accepts, what those costs buy.

    Choose Your Manufacturing Climate Risk Toolkit

    Select the asset-level assessment, valuation, and supply-chain resource that matches your facility diligence, insurance placement, or financial reporting needs:

    Free Field Summary

    Physical Risk Quick Card

    2-page field card: the article’s acute vs chronic hazard taxonomy, return-period damage mechanisms, and quick-reference threshold values condensed onto one reference card.

    FREE
    direct download
    • Acute Hazard Register (100/500-yr flood, Cat 4/5 cyclone/surge, WUI/smoke)
    • Chronic Stress Drift (Wet-bulb Tw, Aqueduct BWS, thermal derate)
    • Inundation Damage Heuristics: ~0.5 m electrical, ~1.5 m heavy equipment
    • Wet-Bulb Thresholds: low-30s °C labour loss & 35 °C survivability limit
    • Water Scarcity Caps: WRI Aqueduct BWS >40% (High) & >80% (Extreme)
    • Thermal Efficiency Derating: 0.5–0.7% output loss per °C above 15 °C ISO

    Download Free PDF

    Working Pack

    Manufacturing Physical Risk Audit Pack

    Printable, fillable 5-sheet working pack with SSP scenario planners, 0.05° grid check sheets, EAL DCF valuation models, WACC logs, and Tier-N cascade matrices.

    $7.00
    one-time
    • SSP Horizon Planner (2026–2030, 2031–2040, 2041–2060 Windows)
    • 0.05° (≈5 km) Grid Resolution & Micro-Geography Elevation Check
    • Complete Acute vs Chronic Hazard Register with Working Metrics
    • EAL Valuation Model: ∫ P(h) × V(h) × Exposure + DCF Integrator
    • No-Double-Count WACC Audit Protocol & Residual-Only Premium Log
    • IAS 36 & ASC 360 Impairment Indicator & Useful-Life Review Sheet
    • Business Interruption Formula Sheet with Spot Energy & Water Surge Costs
    • 3-Layer Insurance Sizing Model (Parametric, Property/BI, Tail Reserve)
    • Tier-N Supplier Cascade Matrix (Wafer fabs, polymers, barges, ports)

    Buy Audit Pack ($7) →

    AI Intensive
    Book for Bots

    Manufacturing Climate Risk Operator

    Structured 8-page AI playbook for ChatGPT and Claude: 8 autonomous routines, EAL valuation engines, WACC double-count auditors, and Tier-N cascade mappers.

    $17.00
    one-time
    • Routine 1: SSP Horizon & Scenario Setter (/horizon)
    • Routine 2: Hyper-Local Hazard & 0.05° Coordinate Screener (/hazard)
    • Routine 3: Chronic Stress & Thermal Derating Rater (/chronic)
    • Routine 4: EAL Valuation Builder & DCF Deduction Engine (/eal)
    • Routine 5: WACC Double-Count & IAS 36 Impairment Auditor (/wacc-audit)
    • Routine 6: Business Interruption & Spot Surge Pricing Calculator (/bi-calc)
    • Routine 7: 3-Layer Insurance & Tail Reserve Designer (/insurance)
    • Routine 8: Tier-N Bottleneck & Supply-Chain Cascade Mapper (/tier-n)
    • Multi-Turn Prompt Router & Comprehensive Facility Audit (/all)

    Buy Operator ($17) →

    All payments securely processed by Square • Apple Pay, Google Pay & Corporate Cards Accepted

    Frequently asked questions

    What is Expected Annual Loss, in one sentence?

    The probability-weighted average of what physical hazards will cost an asset per year — hazard probability times asset vulnerability times exposed value, summed across hazards — used as a cash-flow deduction in valuation and as the sizing basis for insurance and reserves.

    Should we add a climate premium to WACC as well?

    Not on top of EAL-adjusted cash flows for the same risks — that double-counts. A discount-rate premium is defensible only for identified risks that cannot be modelled into cash flows, and the file should say which risks those are.

    How is wet-bulb temperature different from the heat index we use for worker safety?

    Worker-safety regimes are generally specified in WBGT (wet-bulb globe temperature), which adds solar load to the wet-bulb reading. Wet-bulb temperature itself governs evaporative cooling performance and marks the physiological limit — sustained exposure near 35°C wet-bulb is not survivable. The two metrics are related, not interchangeable, and conflating them produces wrong thresholds in both directions.

    Our plants are fine — why map suppliers the same way?

    Because the cascade does not respect your fence line. The 2011 Thailand floods stopped production on other continents through tier-2 and tier-3 concentration. Supplier nodes get the same hazard screen, the same scenario set, and mitigation priced through the same expected-loss logic.


    Sources: CMIP6 / SSP scenario framework; WRI Aqueduct 4.0 baseline water stress; catastrophe-model EAL architecture (hazard × vulnerability × exposure) as standard practice in insurance and climate-valuation literature; IAS 36 / ASC 360 impairment frameworks; Sherwood & Huber on the 35°C wet-bulb physiological limit; case record: 2011 Thailand (Chao Phraya) floods and hard-drive supply shock, February 2021 Texas freeze petrochemical/resin outages, Rhine low-water episodes 2018/2022. Thresholds identified in the text as working heuristics are engineering rules of thumb, not standards; asset-level conclusions require asset-level engineering data.

  • Data Centers in Dry Places: A Physical-Risk and Water-Scarcity Assessment Method

    Data Centers in Dry Places: A Physical-Risk and Water-Scarcity Assessment Method

    Updated Nov 1, 2026 — added the free dry-site risk quick card, data center water risk pack, and dry-site assessor bot book downloads to this guide.

    The AI build-out changed what a data center risks. Rack densities have climbed from a historical 10–15 kW to 40–100+ kW for GPU clusters, and every one of those kilowatts arrives as heat that has to leave the building — historically, by evaporating water. At the same time, sites chosen for cheap power, land and tax treatment cluster in exactly the basins where water is contested: the US Sun Belt, southern Europe, northern India, parts of East Asia. The result is a portfolio of facilities whose core input — cooling — depends on a resource their hosts may not be able to supply through a drought year. This guide sets out the assessment method operators and their ESG teams are converging on: screen the hazards geospatially, stress the thermal design honestly, measure water stress rather than water volume, and extend the analysis upstream to the fabs the whole industry depends on.

    Instant Engineering & ESG Downloads

    Data Centers in Dry Places: Quick Card, Assessment Pack & Bot Book

    Downscaled CMIP6 projection tools, 28–32°C wet-bulb thermal crossover models, N+1/N+2 water buffer scorecards, and machine-executable bot routines built directly from the physical-risk and water-scarcity assessment method.

    Quick Reference
    FREE

    Dry-Site Risk Quick Card

    2-page field card: the article’s 4 hazard pathways, 3-pass assessment method, and water stress toolkit (WUE vs PUE, Aqueduct 40–80% / >80%, ISO 14046 / AWARE lifecycle footprints, and upstream fab exposure), condensed onto one card.

    Download Free PDF

    Direct download • No email gate

    Working Pack
    $7

    Data Centers in Dry Places Pack

    6-sheet printable working pack: Hazard-to-cashflow reference sheet, Pass 1 geospatial exposure worksheet (CMIP6 SSP2-4.5/5-8.5), Pass 2 thermal crossover worksheet (28–32°C wet-bulb band), Pass 3 redundancy scorecard (N+1/N+2, 48–72h fuel & water buffer), Water-stress-not-volume quick reference, and Phase 1–4 execution tracker.

    Get Assessment Pack ($7) →

    Instant checkout • Square verified

    AI Intensive
    Book for Bots
    $17

    Dry-Site Assessor Bot Book

    Feed to ChatGPT or Claude: 7 AI-run routines (/pass-one, /wet-bulb, /redundancy, /basin-truth, /permit-audit, /disclosure-upstream, /exec-memo) with embedded output router to map CMIP6 site hazards, stress-test 28–32°C wet-bulb crossover, audit municipal drought curtailment hierarchies, and draft ESRS/IFRS/TNFD disclosures.

    Get Bot Book ($17) →

    Software made of words • Instant delivery

    The hazard set

    Hazard Driver Impact pathway Financial expression
    Extreme heat Rising ambient temperatures; urban heat islands Evaporative cooling efficiency falls with wet-bulb temperature; mechanical chillers carry the load PUE deteriorates; energy costs spike; thermal throttling in the tail
    Water scarcity & drought Precipitation shifts; aquifer depletion Municipal curtailment; industrial water prices rise Forced reduction in cooling withdrawal; dry-cooling retrofits; tanker logistics in extremis
    Flood & inundation Extreme rainfall; riverine and coastal surge Substations flood; fuel deliveries for backup generators are cut Long outages; asset damage; insurance repricing (see our stranded-assets guide)
    Grid stress & wildfire Peak demand colliding with heat; transmission fire risk Load shedding; public-safety shutoffs Generator hours accumulate — Scope 1 diesel, fuel-supply exposure, permit pressure

    The assessment method, in three passes

    Pass one — geospatial exposure mapping. Plot every facility against downscaled climate projections (CMIP6 under SSP2-4.5 and SSP5-8.5 are the working pair) at 2030, 2040 and 2050 horizons: temperature and wet-bulb trajectories, flood designations, basin-level water stress. The output is a risk taxonomy — low / medium / high / critical — per asset, not per portfolio. Portfolio averages conceal the only thing that matters, which is which specific buildings sit in which specific basins.

    Pass two — thermal and electrical sensitivity. Stress the cooling design against the projected wet-bulb tail (the 28–32°C wet-bulb band is where evaporative systems begin failing to hold ASHRAE environmental envelopes unaided) and calculate the crossover: at what ambient condition does the facility need full mechanical support, what does that do to PUE and power draw, and does the utility contract — and the grid behind it — carry that load on the same afternoon every other customer peaks?

    Pass three — redundancy and vulnerability scoring. Grade what the site can survive: N+1 / N+2 depth, on-site fuel autonomy (48–72 hours is the common design band), dual utility feeds, flood barriers and elevation, and — routinely underweighted — the water redundancy: second source, storage volume, reclaimed-water optionality.

    Engineering & Siting Tools

    Stress-Test Your High-Density Compute Siting Before the Next Drought Declaration

    Siting 40–100+ kW GPU clusters in the US Sun Belt, southern Europe, India, or East Asia creates direct balance sheet exposure when municipal water authorities face summer drought. Evaporative cooling fails to hold ASHRAE envelopes unaided in the 28–32°C wet-bulb band, triggering chiller spikes on the exact afternoons regional grids face peak load-shedding risk. Use our printable 6-sheet assessment pack to model asset-level CMIP6 SSP2-4.5/5-8.5 trajectories, calculate mechanical crossover points, and audit 48–72hr fuel and water redundancy buffers — or deploy the AI Bot Book to automate geospatial screening, municipal drought curtailment audits, and board-ready capital allocation memoranda.

    ☑

    What’s In The Toolkit:

    • Hazard-to-Cashflow Matrix: Heat, drought, flood, wildfire.
    • Pass 1 CMIP6 Screening: 2030/2040/2050 4-band taxonomy.
    • Pass 2 Thermal Crossover: 28–32°C wet-bulb & PUE spike.
    • Pass 3 Redundancy Grid: N+1/N+2, 48–72h fuel & water buffer.
    • Water Stress & LCA: 0.2 L/kWh WUE & ISO 14046 / AWARE.
    • AI Bot Book ($17): 7 executable bot routines + router.
    Secure 1-Click Square Checkout

    Water: measure stress, not just volume

    A litre consumed in a wet basin and a litre consumed in a stressed basin are different facts, and volumetric reporting treats them as identical. The working toolkit corrects for that:

    • WUE (Water Usage Effectiveness) — annual water use ÷ IT equipment energy (L/kWh). The efficiency baseline. Evaporative fleets run well above 0.2 L/kWh; the design frontier — dry cooling, closed-loop and direct-to-chip liquid cooling — targets below 0.2 and approaches zero on site. Report WUE alongside PUE or not at all: the two trade against each other, and optimizing one in secret is how facilities end up efficient on paper and fragile in fact.
    • WRI Aqueduct (and the WWF Water Risk Filter) — basin context: baseline water stress (High at 40–80%, Extremely High above 80%), seasonal variability, groundwater decline, regulatory and reputational exposure. A facility in an Extremely High basin needs a mitigation plan regardless of its WUE.
    • ISO 14046 water footprinting — life-cycle assessment of direct and indirect water (including the water embedded in purchased electricity), scarcity-weighted with characterization factors such as AWARE. This is the step that catches the shell game: a “zero-water” site on a coal-heavy grid has moved its water, not eliminated it.
    • Source Water Vulnerability Assessment — the local audit: the municipal supplier’s own sustainability, recharge rates, drought allocation hierarchies (who gets cut first, by law), and competing agricultural and residential demand growth.

    Disclosure anchors

    ESRS E3 (Water and Marine Resources) requires in-scope companies to report water consumption — specifically in water-stressed areas — with watershed context, alongside ESRS E1 for the physical-risk scenario analysis itself. IFRS S2 requires the financial-effects version: what physical risk does to position and cash flows, and what adaptation capital is allocated against it. The TNFD’s LEAP approach (Locate, Evaluate, Assess, Prepare) gives the nature-dependency framing site selection teams increasingly use. And beneath the frameworks sits the layer that binds first in practice: municipal permitting. Local ordinances are progressively restricting potable-water extraction for industrial cooling and pushing facilities toward reclaimed and non-potable feeds — the permit, not the framework, is where water strategy becomes compulsory. (The framework map is in our compliance frameworks overview.)

    Upstream: the fab problem

    A data center’s water risk does not end at its fence line; its supply chain concentrates in the same hazard. Advanced semiconductor fabrication is ultra-pure-water intensive, and fab capacity concentrates in drought-exposed geographies — Taiwan (whose 2021 drought forced water trucking to fabs) and Arizona among them. A single-point failure there is a server-availability event everywhere. The same interdependency runs through power: the embedded water footprint of regional generation — hydro reliability in drought, thermal-plant cooling limits in heatwaves — is the data center’s availability risk wearing another name. A complete assessment maps the top upstream nodes (fabs, cold-plate and PDU manufacturing, grid regions) through the same hazard screen as the facilities themselves.

    Choose Your Data Center Physical-Risk & Water Assessment Toolkit

    Select the engineering and resilience resource that matches your site selection, facility audit, or ESG disclosure needs:

    Free Field Summary

    Dry-Site Risk Quick Card

    2-page field card: the article’s 4 hazard pathways, 3-pass assessment method, and water stress toolkit (WUE vs PUE, Aqueduct 40–80% / >80%, ISO 14046 / AWARE lifecycle footprints, and upstream fab exposure).

    FREE
    direct download
    • The 4-Hazard Screening Matrix & Financial Expressions
    • Pass 1 CMIP6 Downscaled Screening Protocol
    • Pass 2 Thermal Crossover & 28–32°C Wet-Bulb Band
    • Pass 3 Redundancy (N+1/N+2, 48–72h Fuel & Water Buffer)
    • WUE vs PUE Coupled Reporting Frontier (<0.2 L/kWh)
    • WRI Aqueduct High (40–80%) & Extremely High (>80%) Triggers

    Download Free PDF

    Working Pack

    Data Centers in Dry Places Pack

    Printable, fillable 6-sheet working pack with hazard-to-cashflow matrices, CMIP6 screening registers, thermal crossover calculators, and redundancy scorecards.

    $7.00
    one-time
    • Hazard-to-Cashflow Reference Sheet & Siting Risk Matrix
    • Pass 1 Geospatial Exposure Worksheet (CMIP6 SSP2-4.5/5-8.5)
    • Pass 2 Thermal Crossover Worksheet (28–32°C Wet-Bulb Band)
    • Pass 3 Redundancy Scorecard (N+1/N+2, 48–72h Fuel & Water)
    • Water-Stress-Not-Volume Quick Reference & Audit Checklist
    • Phase 1–4 Execution Tracker & Regulatory Disclosure Matrix

    Buy Assessment Pack ($7) →

    AI Intensive
    Book for Bots

    Dry-Site Assessor Bot Book

    Structured 8-page AI playbook for ChatGPT and Claude: 7 autonomous routines, wet-bulb failure band models, municipal permit audits, and upstream fab screens.

    $17.00
    one-time
    • Routine 1: Pass-One Geospatial Mapper (/pass-one)
    • Routine 2: Wet-Bulb Crossover Stress Test (/wet-bulb)
    • Routine 3: Redundancy & Water-Resilience Scorer (/redundancy)
    • Routine 4: WUE-vs-PUE & ISO 14046 Basin Truth (/basin-truth)
    • Routine 5: Source Water & Permit Auditor (/permit-audit)
    • Routine 6: Upstream Fabs & Disclosure Mapper (/disclosure-upstream)
    • Routine 7: Master Synthesis & Executive Memo (/exec-memo)

    Buy Bot Book ($17) →

    All payments securely processed by Square • Apple Pay, Google Pay & Corporate Cards Accepted

    The execution roadmap

    Phase 1 (months 1–3) — audit. Screen 100% of owned and leased locations through Aqueduct and the downscaled projections; classify every site into the four-band taxonomy; commission Source Water Vulnerability Assessments for the high and critical bands.

    Phase 2 (months 4–12) — cooling transition. In stressed basins, mandate the low-water architectures for new high-density deployments — dry cooling, direct-to-chip liquid, rear-door heat exchangers — and retrofit evaporative systems with adiabatic assist to cut peak-season draw. Design decisions made in this phase are 15-year commitments; the basin projections, not this year’s rainfall, are the design basis.

    Phase 3 (months 12–18) — circular sourcing. Exit potable municipal water for industrial cooling: reclaimed municipal wastewater, industrial greywater, on-site rainwater harvesting. This is also the phase where allocation politics get managed — a facility that does not compete with residents for drinking water holds a materially stronger position in a drought allocation fight.

    Phase 4 (ongoing) — replenishment and transparency. Watershed restoration in operating basins — wetland creation, aquifer recharge, invasive removal — against volumetric replenishment targets. The pledge benchmark is set by the largest operators: Microsoft’s commitment to be water positive by 2030, and Google’s target of replenishing 120% of its freshwater consumption. Pair the projects with public, near-real-time usage reporting; in stressed basins, secrecy about consumption reads as guilt about consumption.

    Frequently asked questions

    What’s the difference between WUE and PUE — and why report both?

    PUE measures energy overhead (total facility energy ÷ IT energy); WUE measures water overhead (annual water ÷ IT energy). Cooling choices trade one against the other: evaporative cooling improves PUE by spending water; dry cooling saves water by spending energy. Reporting only one invites optimizing the reported number at the expense of the hidden one.

    Does direct-to-chip liquid cooling eliminate water risk?

    It largely eliminates on-site evaporative demand — the loop is closed. It does not eliminate the water embedded in the electricity the facility buys (generation cooling and hydro dependence), nor the upstream fab water in its servers. ISO 14046 footprinting exists precisely to keep that distinction honest.

    What water-stress level should trigger a mitigation plan?

    On WRI Aqueduct’s baseline water stress scale, High (40–80%) warrants a documented mitigation plan; Extremely High (above 80%) warrants one before further capacity is added. The trigger is the basin classification, not the facility’s own consumption — a small consumer in a critical basin still faces curtailment politics and allocation hierarchies.

    Why do hyperscalers publish replenishment pledges — is that operations or PR?

    Both, and the operational part is real: replenishment projects (wetlands, recharge) raise the basin’s effective supply for every user including the operator, and the pledges — Microsoft water-positive by 2030, Google at 120% of consumption — are volumetric commitments that can be audited against reported consumption. The PR value collapses quickly if the underlying consumption data isn’t published with them.


    Sources: WRI Aqueduct 4.0 (baseline water stress bands); The Green Grid WUE metric definition; ISO 14046 water footprint standard and AWARE characterization factors; ASHRAE thermal environmental envelopes; CMIP6 scenario framework (SSP2-4.5, SSP5-8.5); ESRS E3 and E1; IFRS S2; TNFD LEAP approach; Microsoft (water positive by 2030) and Google (120% replenishment) public commitments. Site-level conclusions require site-level hydrological data; basin classifications are screening instruments, not engineering determinations.

  • Transition Risk in Heavy Industry: CBAM’s Ramp, Carbon Scenarios and the CapEx Decisions They Force

    Transition Risk in Heavy Industry: CBAM’s Ramp, Carbon Scenarios and the CapEx Decisions They Force

    Physical risk strands assets by breaking them or uninsuring them — our companion guide covers that pathway. Transition risk strands them by arithmetic: a carbon price lands on the cost base, margins compress, and plant designed for a 30-year life stops clearing its hurdle rate in year eight. The forcing event for the next decade is the EU’s Carbon Border Adjustment Mechanism, whose definitive regime began on January 1, 2026 — and whose actual shape is widely misreported. CBAM is not a cliff. It is a ramp with published steps, and planning against the ramp rather than the headline is the difference between an orderly CapEx programme and a disorderly write-down.

    CBAM: the ramp is the story

    In 2026, almost nothing is charged — and that is precisely the trap. Importers of iron and steel, aluminium, cement, fertilisers, hydrogen and electricity into the EU must be authorised declarants, must measure embedded emissions, and accrue obligations from January 1, 2026. But under the simplification regulation, no certificates are sold during 2026 at all. The verified calendar:

    Date What happens
    Jan 1, 2026 Definitive regime begins; obligations accrue; only 2.5% of embedded emissions are chargeable (the CBAM factor, mirroring 97.5% free ETS allocation)
    2026 prices Certificate price = EU ETS quarterly average: €75.36/t (Q1 2026), €75.28/t (Q2 2026)
    Feb 1, 2027 Certificate sales open on the common platform; declarants buy against 2026 imports
    Sep 30, 2027 First annual declaration and surrender, covering 2026 imports
    By 2030 CBAM factor rises to 48.5% chargeable
    Jan 1, 2034 Factor reaches 100%; free allocation for CBAM sectors is gone

    Two consequences follow. First, the 2026 bill is small enough to breed complacency — at the Q2 price and the 2.5% factor, a tonne of blast-furnace steel carries a charge measured in single euros, against a gross figure above €100 at full coverage. The exposure is the curve, not the first step. Second, the binding constraint in 2026 is not money but data: verified embedded-emissions figures from non-EU producers, because default values are deliberately unattractive and the first declaration lands in September 2027. (Our Scope 3 supplier data guide covers the collection mechanics.) The same tightening runs through the EU ETS itself — the cap shrinks annually under the linear reduction factor (4.3% a year through 2027, 4.4% from 2028) — and beyond Europe: China’s national ETS, long confined to power, is extending to steel, cement and aluminium. Carbon cost curves for heavy industry are being rewritten in every major market at once.

    What a carbon price does to a balance sheet

    The sequence is mechanical: compliance cost compresses margin; compressed margin shortens economic life; shortened life forces the accounting to follow. Depreciation schedules built on 30-to-40-year lives get revised toward regulatory horizons, raising the annual charge. Cash-generating units that no longer clear recoverability tests take impairment charges (the IAS 36 / ASC 360 mechanics are set out in the companion guide). Credit assessments absorb the same facts — rating agencies now model transition vulnerability explicitly — and refinancing arrives on worse terms for unhedged carbon intensity, in a market that increasingly prices the exposure even where no regulator compels it. None of this requires a carbon price of $300. It requires a carbon price that is real, rising on a published schedule, and applied to a cost base that cannot move. Exposure differs sharply by sector:

    Sector Assets most exposed Principal triggers Working horizon
    Oil & gas High-break-even reserves (oil sands, deepwater), unrefined midstream Demand peak, engine phase-outs, methane regulation, low-cost displacement 2026–2032
    Power & utilities Unabated coal; gas peakers without capture Clean-energy mandates, storage cost parity, intensity limits, merit-order displacement 2026–2030
    Steel & metals Blast furnace–BOF lines without capture CBAM, green-steel procurement by automakers, scrap-EAF and DRI competition 2027–2035
    Cement & materials Wet-process kilns, high-clinker lines without capture or SCMs Green public procurement, carbon costs in building codes, local caps 2028–2035
    Chemicals & refining Steam crackers, fuel-focused refineries Circular-economy mandates, heat electrification, falling fuel demand 2028–2035

    The horizons are planning judgments, not predictions — but they are the right shape: power and upstream oil face the earliest tests; cement and chemicals get a longer runway because their abatement options are harder, not because their exposure is smaller.

    Scenarios: use them as stress tests, not forecasts

    The NGFS scenario families — Net Zero 2050 (orderly), Delayed Transition (disorderly), Current Policies (hot house) — are the standard grammar, and their carbon prices are the most misused numbers in the field. Scenario prices are model outputs: they differ by model, region and vintage, and any single band quoted without those qualifiers is decoration. Used properly, the scenarios answer a narrower question: does this CapEx book survive each path? In the orderly path, carbon costs rise early and predictably — transition impairment is structured, and replacement technology enjoys cheap capital. In the delayed path, the same costs arrive after 2030 in compressed form — the write-downs concentrate. In the current-policies path, transition pressure fades and physical risk does the damage instead. A capital plan that only works in one of the three is not a plan; it is a bet, and the board should hear it described that way.

    The abatement menu, and how to order from it

    Capital allocation committees rank options on a marginal abatement cost curve (MACC): cost per tonne avoided against volume available. The main industrial pathways, with indicative cost ranges as commonly assessed in the literature — treat them as orientation, not quotes:

    Pathway Readiness Indicative abatement cost Reduction potential Binding prerequisite
    Green hydrogen (DRI steel, chemical feedstock) Demonstration–early commercial ~$120–220/tCO₂e 85–95% of process emissions Very cheap renewable power; electrolyser scale; H₂ transport
    CCUS Commercial for concentrated streams ~$70–140/t (concentrated); higher when dilute 80–90% of point-source emissions Storage geology; shared CO₂ networks; liability rules
    High-temperature electrification Pilot–early commercial ~$50–130/t Up to ~100% of process-heat emissions Grid capacity and reliability; electricity–gas price spread
    Biomass / alternative fuels Commercial ~$40–90/t 30–60% of thermal emissions Certified sustainable supply; burner modification

    Below the line sit the negative-cost quick wins — waste-heat recovery, combustion tuning, steam and compressed-air leak programmes, variable-frequency drives — which pay back in cash and should never wait for a strategy process. The deep conversions (BF-BOF to hydrogen-ready DRI, kiln retrofits with capture, electric crackers) are the decisions the ramp actually governs: each has a lead time of years, which is why the 2034 full-coverage date is a present CapEx fact, not a future one.

    Internal carbon pricing: the discipline that connects them

    A shadow carbon price inside the investment model is what stops a plant that fails at €75/t from being approved at €0. Two design rules matter more than the level. First, anchor the schedule to prices the company already faces: a shadow price set below the EU ETS level (about €75/t in 2026) that CBAM and the ETS already impose is decoration. An illustrative rising schedule — starting near today’s ETS price, stepping up through the late 2020s as the CBAM factor climbs toward 48.5%, and reaching the low hundreds by the mid-2030s at full coverage — mirrors the company’s actual regulatory curve; each business should build its own from its own exposure. Second, distinguish the instruments: a shadow price only steers evaluation (it appears in NPV and hurdle tests, no cash moves), while an internal fee actually charges business units and funds abatement. Most heavy-industry programmes need the shadow price everywhere first; the fee is a later, harder governance step. IFRS S2 already asks companies to disclose whether and how internal carbon pricing is used in decision-making — the practice is becoming reportable, not merely virtuous.

    Accounting and disclosure, briefly

    The impairment mechanics live in the companion guide; the transition-specific adjustments are three. In value-in-use models: cash inflows fall (volume and margin under carbon cost), cash outflows rise (compliance purchases along the CBAM/ETS ramp), and terminal growth compresses toward zero for exposed assets. One discipline deserves emphasis because it is the standard’s own: IAS 36 requires risk to be reflected in the cash flows or the discount rate — adjusting both for the same transition risk double-counts it, and auditors increasingly probe exactly that. Useful lives and residual values must track the same story (a kiln retired in 2033 is not depreciated to 2055), and CGU boundaries may need redrawing where decarbonisation infrastructure is shared. On disclosure: IFRS S2 requires the CapEx deployed toward climate response and the internal-carbon-price position; ESRS E1 requires the transition plan itself, Taxonomy-aligned CapEx shares, and an analysis of locked-in emissions — whether today’s CapEx commits the company to tomorrow’s carbon costs. California’s regime adds the US layer (see the compliance playbook).

    Ninety days, then ongoing

    Days 1–30 — stranding audit and shadow price. Screen the PP&E register against the CBAM ramp, ETS exposure and the sector horizons above; adopt a shadow-price policy at every capital gate; re-test depreciation lives on the exposed CGUs. Days 31–60 — MACC and feasibility. Build the asset-level abatement curve; commission engineering feasibility on the top pathways; launch the negative-cost quick wins immediately. Days 61–90 — rationalise and finance. Decide the divest/convert/close list while the assets still have buyers; structure transition finance (ring-fenced transition bonds, sustainability-linked facilities, blended structures for first-of-a-kind plant) against the programme. Ongoing — stress and audit. Re-run the scenario tests quarterly against actual ETS/CBAM prices, fold climate-adjusted impairment into the internal audit cycle, and publish Taxonomy CapEx alignment annually. The deliverable rhythm matters more than any single artefact: transition risk moves on a regulatory calendar, and the finance function has to move on the same one.

    Frequently asked questions

    When do we actually pay for CBAM certificates?

    Obligations accrue from January 1, 2026, but certificate sales open February 1, 2027, and the first surrender — with the first annual declaration — is due September 30, 2027, covering 2026 imports. Only 2.5% of embedded emissions are chargeable in 2026; the factor climbs to 48.5% by 2030 and 100% on January 1, 2034.

    Does CBAM apply to a US exporter directly?

    No. The authorised declarant — the EU importer — holds the obligation and buys the certificates. The cost and, more immediately, the verified-emissions data demands travel upstream to the producer. A US exporter experiences CBAM as its EU customers’ data requests and price negotiations.

    What carbon price should our investment models use?

    Not a forecast — a schedule. Anchor to prices already in force where you operate (the EU ETS has priced CBAM certificates at about €75/t through 2026), rise with the published CBAM factor steps, and stress the decision at higher levels under the delayed-transition scenario. A project that only survives at €0 carbon is the finding, whatever schedule you choose.

    Is our existing plant automatically impaired once CBAM applies?

    No. CBAM exposure is an impairment indicator prompting a test, as with the insurance shock in the companion guide. The outcome depends on the asset’s cash flows under the ramp — pass-through ability, abatement options and remaining life. Efficient producers inside a carbon-intensive sector can gain relative advantage as the factor rises.


    Sources: Regulation (EU) 2023/956 (CBAM) as amended by Regulation (EU) 2025/2083 — definitive regime from Jan 1, 2026; certificate sales from Feb 1, 2027; first declaration Sep 30, 2027; CBAM factor 2.5% (2026) → 48.5% (2030) → 100% (2034); European Commission CBAM certificate prices Q1 2026 €75.36/t, Q2 2026 €75.28/t; EU ETS linear reduction factor (Directive (EU) 2023/959); NGFS scenario framework; IAS 36 (incl. the cash-flow/discount-rate double-counting caution) and IFRS S2 / ESRS E1 disclosure requirements. Abatement cost ranges are indicative spans from the published literature, not project estimates.

  • When Insurance Disappears: Stranded Assets, Residual Pools and the Write-Down Mechanics

    When Insurance Disappears: Stranded Assets, Residual Pools and the Write-Down Mechanics

    Updated Nov 1, 2026 — added the free uninsurability quick card, uninsurability-to-write-down pack, and stranded-asset insurance bot book downloads to this guide.

    An asset does not have to flood or burn to lose value. It only has to lose its insurance. The transmission pathway runs in one direction: hazards intensify → primary carriers retreat (non-renewals, exclusions, sub-limits, percentage deductibles) → owners fall back on state residual pools, captives or self-insurance → premiums and retained risk crush net operating income while buyers widen capitalization rates → the asset fails an impairment test it would have passed the year before. Every step is documented in ordinary market and accounting practice; what is new is the speed and the geography. This guide walks the pathway with the real numbers where they exist — California’s FAIR Plan is the clearest gauge in the world right now — and then sets out the accounting mechanics (IAS 36 and ASC 360), the fallback risk-transfer stack, and the disclosure position as it actually stands in late 2026, including one regime that no longer exists.

    Stranded-Asset Toolkit Downloads

    Audit Uninsurability, Covenant Headroom & Impairment Exposure

    Field-ready quick cards, printable impairment & covenant audit worksheets, and AI-powered bot routines built directly from this guide to quantify insurance retreat before write-downs land.

    Field Summary
    FREE

    Uninsurability Quick Card

    2-page field card: The 4 retraction mechanics (sub-limiting, percentage deductibles, ZIP non-renewals, residual strain) plus the fallback stack (captives, parametrics, cat bonds) on one card.

    Download Free PDF

    Direct download • No email gate

    Working Pack
    $7

    Uninsurability to Write-Down Pack

    5-page printable working pack: Portfolio coverage audit checklist, uninsurability heatmap (FAIR Plan gauge reference), retraction spotter, fallback-stack builder, IAS 36 / ASC 360 impairment worksheet, and covenant headroom tracker.

    Get Working Pack ($7) →

    Instant checkout • Square verified

    AI Intensive
    Book for Bots
    $17

    Stranded-Asset Insurance Bot Book

    Feed to ChatGPT or Claude: 6 interactive governance routines (Coverage Fragility Interview, Impairment Test Runner, Covenant Forecaster under NGFS, Contagion Calculator, ART Stack Builder, Disclosure Drafter) with embedded output router.

    Get AI Bot Book ($17) →

    Software made of words • Instant delivery

    The retraction, measured

    California’s FAIR Plan — the state’s insurer of last resort, a pool backed by all admitted insurers — carried $768 billion of exposure and 696,562 policies in June 2026, up roughly 250% from about $220 billion in September 2022. The January 2025 Los Angeles fires alone cost the plan on the order of $3.5–4 billion and triggered a $1 billion assessment on its member insurers in February 2025 — which is the mechanism to understand: when the residual pool cannot pay, the shortfall is assessed back across the admitted market and recovered, in part, from ordinary policyholders. Uninsurability is therefore not only a problem for the properties inside the pool. It is a contingent cost for every insured asset in the state.

    The retraction mechanics repeat across catastrophe-exposed markets:

    • Sub-limiting. Carriers cap windstorm, flood or wildfire cover at a fraction of total replacement cost, forcing owners to layer excess capacity at escalating prices — or carry the gap.
    • Percentage deductibles. Flat deductibles give way to deductibles calculated as a percentage of total insured value, payable per event — a retention that can exceed the historic premium.
    • Non-renewal at scale. Whole ZIP-code clusters exit the admitted market in California, Florida, Texas, Louisiana and comparable exposures elsewhere, irrespective of individual asset quality.
    • Residual-pool strain. Florida’s Citizens grew into the state’s largest property insurer at its 2023 peak; a state depopulation programme has since been moving policies back to private carriers, but a major landfall still concentrates assessment exposure on the market that remains. Public-private structures abroad — France’s CCR, the UK’s Flood Re — face the same recalibration pressure as event frequency outruns the reserves the schemes were priced on.

    The fallback stack: what replaces a primary policy

    Mechanism How it works Balance-sheet reality Where it fits
    Primary P&C insurance Indemnity cover from admitted carriers Premium expense only; no capital committed Assets carriers still want — shrinking set in exposed zones
    Captive insurer A licensed subsidiary insures the parent’s risks Regulatory capital committed up front; risk stays in the group, underwriting margin too Large, diversified portfolios; funding high-frequency, lower-severity layers
    Parametric cover Pays a fixed amount when a measured trigger (wind speed, flood depth) is hit Fast liquidity, no adjustment process; basis risk — the trigger can miss your actual loss Liquidity-critical assets; layers indemnity markets won’t write
    Cat bonds / ILS Collateralized cover sold to capital markets via an SPV High setup cost; multi-year, fixed capacity Institutional-scale tail exposure, typically $100M+ programmes

    None of these is a like-for-like replacement at the old price. That gap — between historic underwriting cost and the new cost of the stack — is what flows into valuation.

    How uninsurability becomes a write-down

    Losing affordable cover is an impairment indicator, not an automatic loss — and the distinction is where the accounting discipline sits. IAS 36 (paragraph 12) lists significant adverse changes in the legal or business environment among the external indicators that require a test; ASC 360-10-35-21 carries the US equivalent. An insurance shock qualifies on its face: operating costs step up structurally, and in the hard cases lender covenants requiring specified coverage can put the debt itself in question. What follows is a test, run two different ways:

    • IAS 36 (IFRS) — one step. Impairment exists if carrying amount exceeds recoverable amount: the higher of fair value less costs of disposal and value in use. Value in use must reflect the new insurance economics — elevated premiums and retained risk inside the cash flows, and a discount rate that prices an asset buyers now see as partially uninsurable.
    • ASC 360 (US GAAP) — two steps. First, recoverability: are total undiscounted future cash flows from use and disposition below carrying value? Only if that test fails is the loss measured, as carrying value minus fair value (ASC 820).

    Fair value work (IFRS 13 / ASC 820) on an uninsurable asset is Level 3 work — unobservable inputs — and two adjustments do most of the damage: the discount rate widens for unmitigated tail risk, and the exit capitalization rate expands for illiquidity. An illustrative formulation used by valuation teams makes the channel explicit: fair value equals the stream of NOI minus an insurance deficit term (the excess of new premiums plus retained-loss expectation over historic underwriting cost), discounted at the risk-adjusted rate. The formula is a modelling choice, not a standard — but some version of that subtraction is now in every serious appraisal of an exposed asset.

    The covenant cascade fires before the write-down lands. Premium escalation cuts NOI (DSCR numerator) while revaluation cuts appraised value (LTV denominator):

    Ratio Definition Transmission Typical covenant zone
    DSCR NOI ÷ debt service Premium spikes reduce NOI directly Minimum ~1.20–1.25×
    LTV Debt ÷ appraised value Write-downs shrink the denominator; debt is static Maximum ~65–75%
    ROA Net income ÷ total assets Higher opex and impairment charges hit both sides Internal hurdle rates; rating-agency scrutiny

    A DSCR breach typically triggers cash sweeps and distribution lockups; an LTV breach can require an equity cure or principal paydown. These are lender conversations that happen on renewal dates, not accounting dates — which is why the audit below starts with policy expiries.

    Valuation & Impairment Suite

    Model Your Insurance Deficit Before Covenants Default

    Losing affordable cover is an impairment indicator under IAS 36 and ASC 360. Equip your treasury, risk, and accounting leads with fillable valuation worksheets that calculate the insurance deficit term, model DSCR/LTV headroom buffers, and run interactive AI prompts to audit policy files and stress-test NGFS transition paths.

    📊

    What’s In The Impairment Suite:

    • Portfolio Audit Checklist: TIV, sub-limits & covenants.
    • Heatmap & FAIR Plan Gauge: Low-to-critical rubric.
    • Stack Builder: Captive, parametric & cat bond layers.
    • Impairment Steps: IAS 36 VIU vs ASC 360 Level 3.
    • Bot Book ($17): 6 AI routines & embedded router.
    Secure 1-Click Square Checkout

    Disclosure: the position as it actually stands

    ISSB IFRS S2 is the live global baseline. Paragraphs 15–21 require disclosure of the climate risks that could affect an entity’s prospects, the quantified financial effects on position, performance and cash flows across short, medium and long horizons, and how the strategy responds. Insurance availability is not a named line item — but an asset whose cover has collapsed is squarely inside “risks that could reasonably be expected to affect cash flows and access to finance,” and the financial-effects disclosure is where the write-down story gets told.

    ESRS E1 (CSRD) adds the double-materiality side: undertakings disclose material physical risks, the assets exposed to them, and — under E1-9 — the anticipated financial effects of those risks. One practical recommendation, offered as practice rather than requirement: quantify the split of the portfolio between commercial cover, residual pools and self-insurance. No standard mandates that exact cut today; assurers and lenders increasingly ask for it anyway, and it is cheap to produce from the Phase 1 audit below.

    The United States federal rule is gone — plan accordingly. The SEC’s 2024 climate disclosure rules (the source of the often-cited Regulation S-K Items 1502/1503) were stayed before they ever applied to a filing; the Commission voted to end their defense in March 2025, and on May 29, 2026 it proposed rescinding them in their entirety. Any framework document that still lists the SEC rule as a live mandate is out of date. The operative US disclosure regime for climate risk is now California’s — SB 253 (emissions) and SB 261 (climate-risk reports) — covered end-to-end in our compliance playbook, layered on ordinary materiality principles. Our frameworks map places the regimes side by side.

    Scenario analysis is the stress frame. The NGFS scenario families — Net Zero 2050 (orderly: transition risk front-loaded, physical risk contained), Delayed Transition (disorderly: policy shock after 2030, repricing concentrated), and Current Policies (hot house: transition risk low, physical risk severe) — give boards a common grammar for the write-down question. For uninsurability specifically, the disorderly and hot-house paths matter most: one reprices the asset through policy, the other through the insurance market, and portfolios should be stress-tested against both.

    A twelve-month action plan

    Phase 1 (months 1–3) — coverage and exposure audit. Map every asset against hazard layers (flood, wildfire/WUI, storm surge) and against its own policy file: expiry dates, deductible structures, sub-limits, covenant insurance requirements. Deliverable: a portfolio uninsurability heatmap — low / moderate / high / critical — that ranks assets by coverage fragility, not just hazard.

    Phase 2 (months 4–6) — impairment and covenant stress test. Run the IAS 36 / ASC 360 tests on the critical set under premium-escalation and discount-rate-widening assumptions, and model DSCR/LTV headroom under the NGFS disorderly and hot-house paths. Deliverable: a board-level sensitivity report — potential write-down range, covenant breach points, and the dates they bite.

    Phase 3 (months 7–9) — resilience engineering that underwriters reward. Spend CapEx where it changes an underwriting decision: flood barriers, roof hardening, defensible space, power redundancy — documented to carrier mitigation criteria, not to a generic resilience checklist. Deliverable: an asset-hardening package submitted into renewal negotiations as evidence.

    Phase 4 (months 10–12) — restructure the stack. Capitalize the captive layer, place parametric cover for the untriggerable-by-indemnity risks, evaluate ILS for the tail, and wire the outputs into IFRS S2 / ESRS E1 disclosure. Deliverable: an operating alternative-risk-transfer framework with the audit trail the disclosure regimes expect.

    Role Owns Deliverable
    CFO Impairment testing, covenant compliance, ART capital Sensitivity analysis; captive capital plan
    CRO Exposure mapping, scenario testing, renewals Uninsurability heatmap; catastrophe limits
    ESG / Sustainability lead S2 and ESRS E1 disclosure integration Disclosure package; scenario reporting
    Head of Real Estate Retrofits and code compliance Hardening plans; condition assessments

    Operational Tool Comparison

    Compare Uninsurability Tools & AI Audit Systems

    Choose the analytical depth required for your assets: quick field summary, printable impairment and covenant working pack, or intensive AI bot book for your language models.

    Field Summary

    Uninsurability Quick Card

    2-page field card condensing the retraction pathway and the fallback risk-transfer stack.

    • Core transmission pathway: hazards → retreat → NOI drop → write-down
    • The 4 retraction levers: sub-limits, % deductibles, ZIP non-renewal, residual strain
    • California FAIR Plan benchmark: $768B exposure, 696k policies, $1B assessment
    • Fallback stack matrix: primary P&C, captives, parametrics, cat bonds
    • Valuation transmission & covenant cascade quick summary

    FREE

    Download Quick Card (PDF)

    Instant direct download • No email gate

    Static Working Pack

    Uninsurability to Write-Down Pack

    5-page printable & fillable audit system with full tables, checklists, and working logs.

    • Portfolio coverage & exposure audit checklist (hazards vs terms)
    • Uninsurability heatmap worksheet (Low/Mod/High/Critical ranking)
    • Retraction-mechanics spotter (evaluating renewal terms & E&S quotes)
    • Fallback-stack builder worksheet (cost/trigger slots for captives & parametrics)
    • Impairment worksheet: IAS 36 / ASC 360 recoverable-amount calculations
    • Covenant headroom tracker: DSCR/LTV slots & 12-month action plan

    $7.00

    Get Working Pack ($7) →

    Instant delivery • Square checkout

    AI Intensive
    Book for Bots

    Stranded-Asset Insurance Bot Book

    Structured text document feeding 6 executable AI routines to ChatGPT or Claude to audit policy files, model impairments, and draft disclosures.

    • /audit-fragility: Interrogates contracts to build low-to-critical heatmap
    • /test-impairment: Walks IAS 36 & ASC 360 models with insurance deficit
    • /forecast-covenants: Projects DSCR/LTV breach dates under NGFS paths
    • /check-contagion: Calculates FAIR Plan & Citizens assessment exposure
    • /build-art-stack: Generates captive, parametric & cat bond layering
    • /draft-disclosure: Drafts audit-ready IFRS S2, ESRS E1 & SB 261 text
    • Includes embedded output router and functional role assignments

    $17.00

    Get AI Bot Book ($17) →

    Software made of words • Instant delivery

    Frequently asked questions

    Is losing our insurance an automatic impairment?

    No. It is an impairment indicator — under IAS 36 and ASC 360 it obliges a test, and the test decides. Assets with strong cash flows can absorb the new insurance economics on paper; the write-down arrives when recoverable amount (IFRS) or the undiscounted cash-flow test followed by fair value (US GAAP) says the carrying value no longer holds.

    We’re not in the FAIR Plan. Why does its deficit matter to us?

    Because the plan is backed by the admitted market. When claims overwhelm it — $1 billion assessed on member insurers after the January 2025 fires — insurers recover through their own books, including surcharges on ordinary policies where regulators approve them. Residual-pool math is market-wide math.

    What is basis risk in a parametric policy?

    The payout follows a measured trigger (wind speed at a station, water depth at a gauge), not your loss. If the trigger fires and your damage is small, you are overpaid; if your damage is severe and the trigger narrowly misses, you are paid nothing. Parametric cover is liquidity insurance, priced and governed differently from indemnity cover — it complements the stack; it does not replace it.

    Do we still need to prepare SEC climate disclosures?

    No — the 2024 rules never took effect, the SEC stopped defending them in 2025, and rescission was proposed in May 2026. US climate disclosure obligations now run through California’s SB 253 and SB 261 for in-scope companies, plus ordinary materiality-based disclosure. Frameworks documents citing Items 1502/1503 as live requirements are stale.

    At what scale do catastrophe bonds make sense?

    Historically, programmes with limits in the hundreds of millions, where setup and legal costs amortize across multi-year collateralized capacity — sovereigns, utilities, large infrastructure and institutional portfolios. Below that scale, captives and parametric placements usually carry the same layers more cheaply.


    Sources: California FAIR Plan exposure and policy data as disclosed June 2026 (via CDI/KQED reporting) and February 2025 assessment reporting; IAS 36 (incl. ¶12 indicators), ASC 360-10-35 and ASC 820 / IFRS 13 fair value frameworks; ISSB IFRS S2 ¶¶15–21; ESRS E1 incl. E1-9; SEC climate disclosure rules — adoption (Mar 2024), stay (Apr 2024), end of defense (Mar 2025), rescission proposal (May 29, 2026, Rel. 33-11421 reporting); NGFS scenario framework (Net Zero 2050, Delayed Transition, Current Policies). Figures are as published at the time of writing; insurance-market conditions move quickly and asset-level conclusions require asset-level underwriting data.

  • Scope 3 Supplier Data: A Field Guide for Specialty Trades — From Spend-Based Proxies to Job-Level Carbon Data

    Scope 3 Supplier Data: A Field Guide for Specialty Trades — From Spend-Based Proxies to Job-Level Carbon Data

    Updated Nov 1, 2026 — added the free scope 3 quick card, specialty-trades field pack, and field-data coach downloads to this guide.

    Most Scope 3 inventories are built on a fiction of convenience: money spent, multiplied by an industry-average factor. The method — spend-based estimation, usually via environmentally extended input-output (EEIO) models — cannot see that one contractor runs new equipment and another runs old, that one job landfilled everything and another recycled half. It prices the invoice, not the work. For recurring vendors with contracts and billing systems, companies are slowly replacing those proxies with primary data: actual fuel, hours, materials and waste from the supplier’s own operations. For reactive specialty trades — the restoration crew dispatched at 2 a.m., the emergency mechanical repair, the one-off strip-out — almost nobody collects anything. The work is procured under duress, invoiced in lump sums, and either omitted from the inventory or buried inside a spend factor. This guide is about closing that specific gap: what to capture, whose boundary it belongs in, and how to make a field crew’s paperwork into auditable carbon data.

    Field-Tested Scope 3 Toolkit

    Transition Emergency & Specialty Trades from Spend Proxies to Primary Data

    Occupier–owner boundary rules, 12-field job-level intake schemas, equipment runtime logs, MSA contract riders with 15-day payment clauses, and bot-ready AI runbooks built directly from this guide.

    Quick Reference
    FREE

    Scope 3 Quick Card

    2-page field card: The occupier–owner operational control boundary rule, tenant-metered Scope 2 safeguards, and the complete 12-field job-level intake schema mapped to GHG Protocol categories on one reference card.

    Download Free PDF

    Direct download • No email gate

    Working Pack
    $7

    Scope 3 Specialty-Trades Field Pack

    Printable/fillable 6-page working pack: 12-field job-level intake sheet, equipment runtime & fuel source log (kW • grid/diesel/propane), vehicle transport & consumables log, demolition & waste classification tracker, model MSA data rider with 15-day clause, and spend-proxy reconciliation worksheet.

    Get Field Pack ($7) →

    Instant checkout • Square verified

    AI Intensive
    Book for Bots
    $17

    Scope 3 Field-Data Coach for AI

    Feed to ChatGPT or Claude: 8-page executable prompt playbook with 6 interactive AI routines (Reactive-Trade Blind-Spot Audit, Boundary Classifier, 12-Field Completeness Auditor, MSA Rider Generator, 3-Phase Rollout Planner, Proxy-to-Primary Benchmarker) plus embedded router.

    Get Field-Data Coach ($17) →

    Software made of words • Instant delivery

    Why the proxies are on their way out

    Scope 3 is the bulk of most footprints — CDP puts the average at roughly 75% of a company’s total emissions, with sector figures ranging from about 70% to over 90% — so the quality of Scope 3 data is the quality of the inventory. Three forces are pushing from estimates toward activity data:

    • California’s SB 253 requires Scope 1, 2 and 3 reporting for companies doing business in the state above $1 billion in revenue, with Scope 3 phasing in from 2027 (the full regime is in our SB 253 / SB 261 compliance playbook). The categories where specialty-trade emissions concentrate are Category 1 (purchased goods and services) and Category 5 (waste generated in operations).
    • The EU’s CSRD / ESRS E1 requires value-chain disclosure under double materiality. Estimates are permitted where primary data cannot be obtained with reasonable effort — but assurance expectations ratchet, and a number you cannot trace to an activity is a number an assurer will eventually challenge.
    • The GHG Protocol’s Scope 3 Standard is being revised for the first time since 2011. Its Phase 1 progress update (March 2026) proposes exactly the direction this guide assumes: companies would disclose what share of their Scope 3 data is primary, activity-based or spend-based, account for at least 95% of reportable Scope 3 emissions, and use granular supplier data rather than allocating a diversified supplier’s company-wide footprint. A consultation draft of the consolidated standard is expected in 2027. These are proposals, not law — but nobody builds a data system against the direction the standard-setter just announced.

    The reactive-trade blind spot

    Recurring vendors and emergency trades fail data collection for opposite reasons. Recurring services — janitorial, landscaping, scheduled maintenance — run through RFPs and multi-year agreements; the survey goes out once a year and someone answers it. Reactive trades are dispatched first and paperworked later, if at all:

    Attribute Recurring vendor services Reactive specialty trades
    Procurement channel Scheduled RFP; multi-year master agreement Emergency dispatch; duress procurement
    Data infrastructure ESG surveys, centralized billing Paper work orders, decentralized local crews
    Shape of the work Predictable routines, often area-based Job-specific: deconstruction, drying, rebuilding
    Primary carbon drivers Commute fleets, standardized chemicals Equipment run-time, vehicle transport, structural waste
    Current accounting Spend proxies or allocation formulas Omitted, or hidden in lump-sum invoices

    Three root causes compound. Duress procurement: when the pipe has burst, nobody onboards the vendor into an ESG portal before dispatch. Tiered subcontracting: the prime contractor’s invoice covers spot labor, sub-trades and rental equipment whose fuel and hours the prime never sees. Schema mismatch: standard vendor surveys ask for company-level Scope 1 and 2 totals, which a twelve-person restoration firm cannot translate into the carbon content of your specific job. The fix is not a better survey. It is a job-level field set the crew can actually complete.

    Whose emissions are they? The occupier–owner boundary

    Emergency work inside a leased space belongs in the occupier’s Scope 3 — and getting this boundary wrong creates both double counting and gaps.

    Reporting entity Frameworks Scopes that apply What falls inside
    Corporate occupier (tenant) GHG Protocol, SB 253, CSRD Scope 3 Category 1 (services) & Category 5 (waste) Specialty-trade labor, emergency restoration, suite repairs, job-site fuel, demolished materials
    Property owner / asset manager GRESB, ENERGY STAR, NYC LL97, DC BEPS Scope 1 & 2 (base building); Scope 3 Category 13 (downstream leased assets) Central plant, common areas, structural capital projects, shared utilities

    The allocation follows control: the occupier contracts the service, defines the scope, approves the invoice and controls access to the space. One nuance worth capturing in the data model: where drying equipment and air scrubbers plug into tenant-metered power, that electricity is the occupier’s Scope 2 — the service is Category 1, the kilowatt-hours may already sit in the tenant’s own utility data. A field set that records both the equipment hours and the power source keeps the two from being counted twice or not at all.

    A 12-field job-level intake schema

    What follows is a field set this guide proposes — lift it, rename it, adapt the units to your region. It is deliberately small: twelve fields a dispatcher or crew lead can complete from the work order, the fuel log and the waste ticket. Every field maps to a GHG Protocol category so the payload drops into an inventory without translation.

    # Field Format Maps to
    1 Work order ID Alphanumeric ID Administrative matching
    2 Facility / location ID Asset ID or GIS ref Facility allocation boundary
    3 Equipment runtime hours Hours, by equipment power rating (kW) Cat 1 (service); occupier Scope 2 where tenant-metered
    4 Primary fuel source Grid / diesel / propane Category 1 (direct fuel)
    5 Vehicle transport mileage Miles or km Category 1 (transport)
    6 Chemical consumables volume Gallons or litres Category 1 (purchased goods)
    7 Debris / waste volume Tons or cubic yards Category 5 (waste in operations)
    8 Waste stream classification C&D / hazardous / landfill-bound Category 5
    9 Disposal facility type Recycling / incineration / landfill Category 5
    10 Demolished material mass Weight or area Category 5 (embodied carbon loss)
    11 Replacement material mass Weight/area + % recycled content Category 1 (embodied carbon of replacements)
    12 Data quality flag Primary (measured) / secondary (estimated) Assurance & revision-readiness

    Field 12 is the one that future-proofs the rest. The GHG Protocol revision proposals would have companies disclose the share of primary versus estimated data. A payload that already flags which numbers were measured and which were estimated converts that disclosure from a research project into a filter.

    Operational Scope 3 Field Toolkit

    Convert 2 A.M. Emergency Work Orders into Auditable Scope 3 Primary Data

    Scope 3 represents roughly 75% of corporate emissions, yet emergency restoration, strip-outs, and reactive repairs remain trapped in spend proxies. With California SB 253 phasing in Category 1 & Category 5 compliance and the GHG Protocol proposing 95% coverage rules, voluntary surveys are obsolete. Equip your facilities and sustainability teams with printable job-level logs, 15-day MSA contract riders, and autonomous AI audit routines that ingest field paperwork directly.

    ⚙

    What’s In The Field Toolkit:

    • 12-Field Job Intake: Work order to data flag.
    • Equipment Runtime Log: kW rating & fuel source.
    • Tenant Scope 2 Flag: Eliminates double-counts.
    • Debris & Waste Tracker: C&D tons & certified path.
    • MSA Exhibit [X] Rider: 15-day invoice condition.
    • Reconciliation Sheet: Billed hours vs runtime validation.
    Secure 1-Click Square Checkout

    Making it contractual: the MSA data rider

    Voluntary data requests lose to emergency conditions every time; a payment condition does not. The mechanism that works is a rider in the master services agreement tying the field data to invoice approval. Model language, to be adapted by your own counsel:

    Contractor agrees that submission of operational activity data — conforming to the job-level intake schema in Exhibit [X] — is a condition of final work-order approval and invoice disbursement. For all emergency, mechanical and specialty trade services, Contractor shall submit complete field logs detailing (a) equipment operating hours and fuel sources, (b) total transport mileage, (c) mass and classification of demolished debris, and (d) certified waste disposal pathways. Failure to provide complete metrics within fifteen (15) business days of job completion shall withhold invoice payment until data verification is resolved.

    Fifteen days is negotiable; the structure is not. Data as a deliverable, with a deadline, attached to the money.

    The rollout, in three phases

    Phase 1 — pre-qualification. Register specialty-trade vendors in the CMMS alongside recurring vendors. Collect the baseline once: fleet composition, equipment wattage profiles, waste-hauling partners and their disposal facilities. Execute the MSA rider at renewal — or immediately, by amendment, for your highest-volume emergency vendors.

    Phase 2 — dispatch and execution. Work orders issue pre-populated with the twelve fields, so the schema arrives with the job instead of chasing it. Crews log equipment deploy times, generator fuel draw and vehicle trips on the same mobile form they already use for job notes. If the form adds more than a few minutes to closeout, it will be abandoned by the third emergency — design for the 2 a.m. version of your vendor, not the office version.

    Phase 3 — reconciliation and invoicing. The completed payload travels with the itemized invoice. Run one validation that catches most fabrication and most error: logged equipment runtime against billed labor hours — the two should move together. Then export validated payloads to the accounting platform, mapped to emission factors (regional grid factors such as eGRID for electricity; established waste coefficients such as EPA WARM for disposal pathways), and the Category 1 and 5 lines stop being estimates.

    Finally, benchmark the transition honestly. Run one reporting cycle with both methods live: the old EEIO spend factor and the new primary data, side by side, for the same jobs. The gap between them — per job type, per vendor — is your evidence for what the proxies were hiding, and it is the exhibit that justifies the programme’s cost in the next budget round. Our compliance frameworks map shows where this data feeds once collected — CSRD, ISSB and California all draw on the same activity records.

    Specialty-Trades Scope 3 Comparison

    Compare Specialty-Trades Scope 3 Tools & AI Systems

    Select the operational tier that matches your reporting maturity: quick field reference card, printable working pack for field supervisors and dispatchers, or an AI runbook that audits blind spots, classifies boundaries, drafts MSA riders, and benchmarks spend proxies.

    Field Summary

    Scope 3 Quick Card

    2-page field card condensing the occupier–owner operational boundary, Scope 2 safeguards, and 12-field schema onto one reference sheet.

    • Occupier vs owner reporting boundary matrix
    • Operational control allocation rule (Cat 1/5 vs Scope 1/2)
    • Tenant-metered power Scope 2 safeguard flag
    • Complete 12-field intake schema with formats & mapping
    • Field 12 Primary vs secondary data quality rule
    • Quick verification checklist for field dispatch

    FREE

    Download Quick Card (PDF)

    Instant direct download • No email gate

    Static Working Pack

    Specialty-Trades Field Pack

    6-page printable & fillable operational toolkit for facilities managers, corporate sustainability leads, and emergency dispatch supervisors.

    • 12-field job-level intake form with field guidance
    • Equipment runtime log (hours by kW rating & power type)
    • Vehicle transport & chemical consumables tracking worksheet
    • Demolition & structural waste classification log
    • Model MSA data-rider clause with 15-day payment condition
    • Data rider execution & verification checklist
    • Runtime-vs-labor validation & EEIO spend reconciliation sheet

    $7.00

    Get Field Pack ($7) →

    Instant checkout • Square verified • Instant delivery

    AI Intensive
    Book for Bots

    Field-Data Coach for AI

    8-page executable AI runbook: feed directly into ChatGPT or Claude to audit trade blind spots, classify scopes, generate riders, and benchmark proxies.

    • Blind-Spot Audit (/blindspot-audit): Duress & tiered sub interview
    • Boundary Classifier (/boundary-classifier): Cat 1/5 vs Scope 2 triage
    • 12-Field Schema Auditor (/schema-auditor): Work order audit & flags
    • MSA Rider Generator (/rider-generator): Custom Exhibit [X] clauses
    • 3-Phase Rollout Planner (/rollout-planner): CMMS & dispatch schedule
    • Spend Benchmarker (/spend-benchmarker): EEIO vs primary data delta
    • Embedded Output Router: “Software made of words” runtime engine

    $17.00

    Get Field-Data Coach ($17) →

    Instant checkout • Square verified • Instant delivery

    Frequently asked questions

    Which Scope 3 categories cover emergency restoration and specialty-trade work?

    Primarily two: Category 1 (purchased goods and services) for the service itself, its fuel, transport and materials; and Category 5 (waste generated in operations) for demolished material and its disposal pathway. Electricity drawn from the occupier’s own metered supply sits in the occupier’s Scope 2 — record the power source so it is counted once.

    Can we keep using spend-based estimates?

    For now, in most regimes, yes — ESRS permits estimates where primary data cannot be obtained with reasonable effort, and the current GHG Protocol standard accepts spend-based methods. The direction is against them: the Protocol’s revision proposals would require disclosing how much of the inventory is spend-based and would restrict company-wide supplier allocations. Spend-based is a bridge, and bridges have a far bank.

    Who reports the emissions — the tenant or the landlord?

    Both, in different scopes, without double counting if the boundary follows control. The occupier reports the contracted work in Scope 3 Categories 1 and 5; the owner reports base-building energy in Scope 1 and 2 and the leased asset in Category 13. Building-performance regimes like NYC LL97 and DC BEPS assess the asset, which is the owner’s filing problem — powered by data both parties have reason to keep straight.

    Is the 12-field schema an official standard?

    No. It is a field set proposed by this guide, designed so every field maps to an existing GHG Protocol category. The standards — GHG Protocol, ESRS, CARB’s SB 253 rules — specify what must be reported; the job-level capture mechanism is each company’s own design problem, and this is a workable one.

    When does Scope 3 reporting start under California’s SB 253?

    Scope 3 phases in from 2027 for in-scope companies, on the schedule CARB sets; Scope 1 and 2 come first (2026 cycle). The operational implication: the data systems for Scope 3 need to exist before the first Scope 3 year opens, which is why vendor intake belongs in contracts being renewed now.


    Sources: GHG Protocol Corporate Value Chain (Scope 3) Standard (2011) and Scope 3 Standard revision Phase 1 Progress Update (March 31, 2026), incl. Data Quality Indicator and 95% coverage proposals; CDP supply-chain reporting (Scope 3 averaging ~75% of total emissions); MIT Center for Transportation and Logistics, State of Supply Chain Sustainability 2024; California SB 253 and CARB’s implementing regulation (see the compliance playbook linked above); ESRS E1 value-chain provisions. Framework positions are as published at the time of writing; the GHG Protocol items marked as proposals are draft revision content, not final standard text.

BC ESG

ESG Strategy, Sustainability Intelligence, and Business Continuity for Forward-Thinking Organizations

© 2026 BC ESG — Business Continuity, ESG & Sustainability Intelligence